- Dynatrace Community
- Learn
- Dynatrace tips
- Re: PRO TIP - Setting Maintenance Window for suppression of entities not live yet
- Subscribe to RSS Feed
- Mark Topic as New
- Mark Topic as Read
- Pin this Topic for Current User
- Printer Friendly Page
- Mark as New
- Subscribe to RSS Feed
- Permalink
02 Mar 2023 01:21 PM
As production entities are created, we try to get Dynatrace put in place during the build/configuration phase. This means that the entity will exist in PROD and therefor trigger alerts even though the host isn't actively taking on any PROD load. This can be problematic since the alerts are being sent to teams with a PROD severity. To mitigate this, we can impose a Maintenance Window to suppress these entities and the potential problem cards they could raise.
One approach to set a never-ending Maintenance Window looking at entities with a 'Suppression' tag that was applied via an automatic tagging rule or a manual tag. Which isn't a bad idea, but when that Go-Live date and time arrives, you will need to remove the 'Suppression' tag from the entity/entities.
Another approach is to set a Maintenance Window for the entities and have that window expire at the Go-Live date and time. Which is a great idea, but Dynatrace will only allow you to target known entities. Meaning the entity must have a Dynatrace ID. This limits your ability to be proactive as you can't define the included entities before they show up in Dynatrace.
So how do we solve this problem - Onboarded Time Tag Via 'FirstSeenTime' values.
This solution works in conjunction with my previous PRO TIP which can be found here: PRO TIP - Setting an onboarding date stamp.
If you have the Onboarded Tags in place then all the challenging work is done, your tags exist, or will exist once the entity in which you are onboarding shows up. The reason we need to use tags is because Dynatrace Maintenance Windows work off the unique entity ID and since the host is not onboarded yet, we do not know what that ID will be. So, let us say your EasyTravel Team built up new servers and you need to add the OneAgent into them, or even from an automated perspective, the EasyTravel Team informs you they are standing up a new server for EasyTravel and they will automatically report into Dynatrace. You just need to ask them two Questions:
1 - When will you provision these servers and add Dynatrace to them?
2 - When will the host(s) be live for Production?
With answers to those two questions, you can Formulate a Maintenance Window. So, let's do that.
Creation Via Dynatrace Settings UI:
This can be done via the UI or API; however you want. In the UI you will open a new Maintenance Window and fill it out as desired in accordance with your organization’s standards for Maintenance Windows. Now at the filter section you will add in the tags as you see fit. Keep in mind we have several types of time levels, we have Weeks, Months, and Years. You can use all three, or you can drop each one to get a broader timeframe. So, if you team has a year to complete the app and will be onboarding things over the year, just include the Year of 2023. This method also applies to month, onboarding over the course of a month, add in that month. All the way down to the smallest time frame of week, stating it will be onboarded in Week 5 out of the 52-week year. If you followed the PRO TIP for setting the Onboarded Tags, they should follow the listed Key: Value Pairs:
Key | Value |
Onboarded Year | YYYY (Example: 2023) |
Onboarded Month | Month MM (Example: Month 02) |
Onboarded Week (Q1-Q2, 2023) | Week ## (Example: Week 07) |
Onboarded Week (Q3-Q4, 2023) | Week ## (Example: Week 40) |
Onboarded Week (Q1-Q2, 2022) | Week ## (Example: Week 07) |
Onboarded Week (Q3-Q4, 2022) | Week ## (Example: Week 40) |
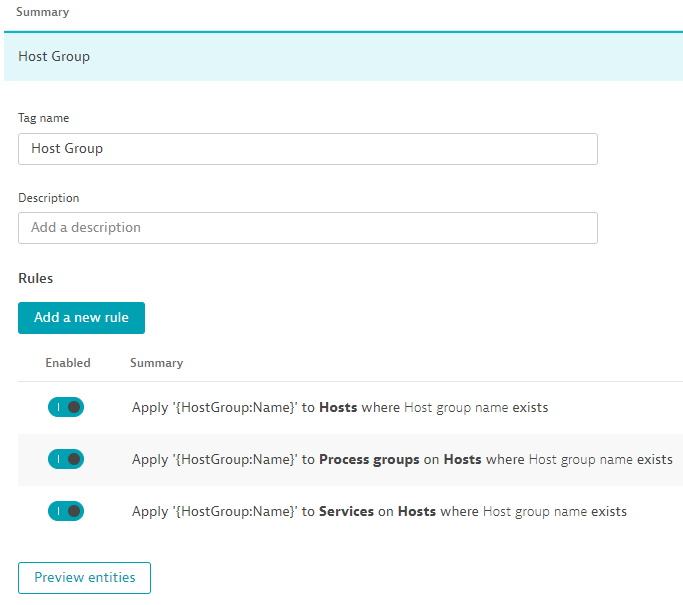
These tags alone are not enough to isolate your Maintenance Window to select entities. Your time frame tags apply to all entities in the environment. So, we need to build one more tag if it is not present already, Host Group Name. you can do this right in the UI and is extremely easy:
Since Host Groups are unique, they also have a Dynatrace ID, so for Host Groups that have not been created yet you cannot target them until after they exist. So, we will use tags since we can define a tag in the Maintenance Window even if it is not present yet.
Once the Tagging Rules are set let us Revisit the Maintenance Window and add in your Host Group Key: Value Pair with Tags.
You will want to add all of these on one filter as it allows you to use "AND" in-between the tags. So, the entities in which this Maintenance Window applies will be entities with tag: Host Group:EZYTRVL AND Onboarded Week: Week 05 AND Onboarded Month: 02 AND Onboarded Year: 2023. So, the entity must have every one of those tags otherwise it will not be included.
If you add a new filter, it will use AND in the string as above, but it will but an OR in-between the two rule filter sets. Which can be extremely useful if you have multiple Host Groups in which this should apply to.
Here is an example:
Make sure you set your start date and time for your Maintenance Window. It does not have to be right on point but needs to be earlier then when the entities go live as the Maintenance Window will only apply to entities once they show up and meet the filter criteria you supplied.
Do not forget the end date and time, this is the most critical as that is when the Maintenance Window will stop and should be in line with the Go-Live Date/Time so alerts can be generated, and integrations triggered for team notification.
Result:
Creation Via Dynatrace API:
Since this method uses the API you can formulate scripts and have them automatically post into your targeted environment. There are two API methods to do this. The first is slated to for depreciation but I will still cover it.
Maintenance Window>Configuration API - Soon to be deprecated:
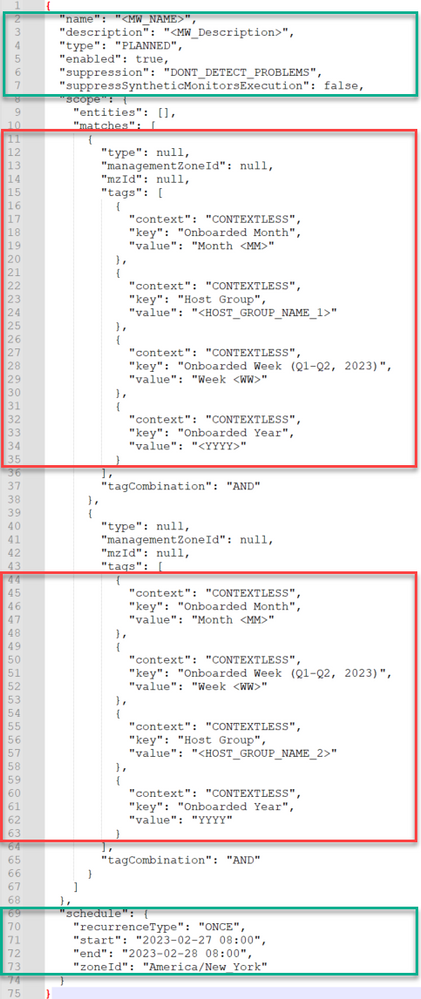
I have supplied these Json templates for you, so you just need to supply your data. Just as above we will cover setting the Maintenance Window with one and two sets of rules depending on your scope. We also will go line by line; I like to use NotePad++ but you can use the text editor of your choice.
Line 2: - Replace <MW_NAME> with the Name of your choosing for this Maintenance Window.
Line 3: - Replace <MW_Description> with the description of your choosing.
Line 4: - [OPTIONAL] Set the Type of MW.
PLANNED/UNPLANNED
Line 5: - [OPTIONAL] Set the state (Enabled) true/false.
True=ON | False=OFF
Line 6: - [OPTIONAL] Set the suppression style of the MW.
DONT_DETECT_PROBLEMS | DETECT_PROBLEMS_DONT_ALERT | DETECT_PROBLEMS_AND_ALERT
Line 16 – 35: Setting Tags:
Line 19: - Set the Month Value. Just replace the <MM> with your two-digit Month.
Line 24: - Set the Host Group Name. Just replace the <HOST_GROUP_NAME_1> with your expected Host Group Name.
Line 29: - Set the Week Value. Just replace the <WW> with your two-digit week.
**Keep in mind, if you select a week that is in Q3-Q4, you will need up update the tag key (Line 28) to reflect the proper key. See the chart above for the list of Keys**
Line 34: - Set the Year Value. Just replace the <YYYY> with your four-digit Year.
**If you are using the Multi Host Group Template, just repeat the steps for lines 16-34**
Line 43/71: - Set the Start time Format: YYYY-MM-DD 00:00
Line 44/72: - Set the End time Format: YYYY-MM-DD 00:00
Congratulations! You have completed the Json, all that is left now is to Copy the entire Json and paste it into the Dynatrace API. Navigate to the ConfigurationAPI>Maintenance Windows>POST Maintenance Windows. Please note, this says its deprecated and greyed out, but you can still use it (At least for now 😊). Select the POST of a new Maintenance Window, Click Try it out, put in your API Token, and paste in the full Json you just compiled, Click execute and the Maintenance Window will be posted. You can also edit it as needed via the UI after this step if you do not feel comfortable editing the Json.
Maintenance Window>Environment V2 API:
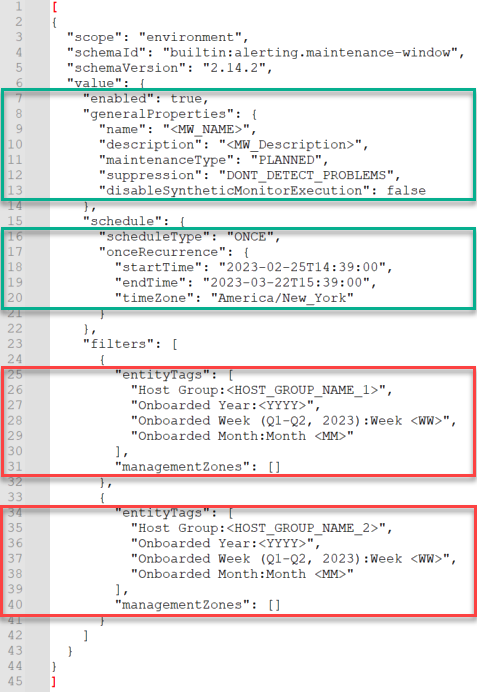
This leads us to the last method to posting a Maintenance Window into Dynatrace. Similarly, as above, I have attached the Json template for the Environment V2 posting of the Maintenance Windows.
Line 7: - [OPTIONAL] Set the state (Enabled) true/false.
True=ON | False=OFF
Line 9: - Replace <MW_NAME> with the Name of your choosing for this Maintenance Window.
Line 10: - Replace <MW_Description> with the description of your choosing.
Line 11: - [OPTIONAL] Set the Type of MW.
PLANNED/UNPLANNED
Line 12: - [OPTIONAL] Set the suppression style of the MW.
DONT_DETECT_PROBLEMS | DETECT_PROBLEMS_DONT_ALERT | DETECT_PROBLEMS_AND_ALERT
Line 18: - Set the Start time Format: YYYY-MM-DDT00:00
Line 19: - Set the End time Format: YYYY-MM-DDT00:00
DO NOT REMOVE THE “T” FROM LINE 18 OR 19
Line 26 – 29: Entity Tags:
Line 26: - Set the Host Group Name. Just replace the <HOST_GROUP_NAME_1> with your expected Host Group Name.
Line 27: - Set the Year Value. Just replace the <YYYY> with your four-digit Year.
Line 28: - Set the Week Value. Just replace the <WW> with your two-digit week.
**Keep in mind, if you select a week that is in Q3-Q4, you will need up update the tag key (Line 28) to reflect the proper key. See the chart above for the list of Keys**
Line 29: - Set the Month Value. Just replace the <MM> with your two-digit Month.
**If you are using the Multi Host Group Template, just repeat the steps for lines 26-29**
Congratulations! You have now configured the Json for the Maintenance Window, all that is left now is to post it into the Dynatrace API. Within the appropriate environment, select the Environment API v2, Scroll down to Settings-Objects. Select the POST of a new Settings Object, Click Try it out, put in your API Token, and paste in the full Json you just compiled, Click execute, and the Maintenance Window will be posted. You can also edit it as needed via the UI after this step if you do not feel comfortable editing the Json.
Solved! Go to Solution.
- Labels:
-
tips and tricks
- Mark as New
- Subscribe to RSS Feed
- Permalink
02 Mar 2023 01:26 PM
Resource Files Attached - Jsons for Single and Double Host Groups (Soon to be deprecated V1 Method)
- Mark as New
- Subscribe to RSS Feed
- Permalink
02 Mar 2023 01:27 PM
Resource Files Attached - Jsons for Single and Double Host Groups (V2 Method)
- Mark as New
- Subscribe to RSS Feed
- Permalink
03 Mar 2023 12:33 PM
Excellent article Chad, much obliged by sharing this.
I would say this is way beyond Pro, it's sheer dynamight! 🙂
- Mark as New
- Subscribe to RSS Feed
- Permalink
05 Dec 2023 04:39 PM
Is it planned to provide support for entitySelector based filtering? This would simplify many things.
Featured Posts


