- Dynatrace Community
- Learn
- Dynatrace tips
- Pro Tip - Dynatrace SaaS - Monitor Adaptive Capture Control
- Subscribe to RSS Feed
- Mark Topic as New
- Mark Topic as Read
- Pin this Topic for Current User
- Printer Friendly Page
Pro Tip - Dynatrace SaaS - Monitor Adaptive Capture Control
- Mark as New
- Subscribe to RSS Feed
- Permalink
25 Feb 2022
09:00 AM
- last edited on
15 Jul 2022
01:03 PM
by
![]() MaciejNeumann
MaciejNeumann
Recently I ran into an issue at a customer where data-quality dropped. I figured out that this had to do with adaptive capture control implemented for Dynatrace SaaS.
I had some fruitful conversations with Dynatrace Product Managers on this topic. And I thought it's important to share this with the community as well.
It was confirmed that SaaS adaptive capture control can limit the processing of service requests to a state where the data gets really aggregated a lot. This is not necessarily a bad thing but it really depends on your architecture, and it can have these impacts:
- no service calls visible for hours on individual services
- only "call spikes" visible on services with large amounts (multiple thousands) of PurePaths aggregated into one.
- custom metrics (based on request attributes) not available or not reporting what is expected
If your architecture (or what you are monitoring of it with Dynatrace) has lots of services and a high amount of service calls (e.g a few 100k/min) you might feel the impact.
Similar to what is described in this blog post for Dynatrace Managed I recommend to also implement some health monitoring for Dynatrace SaaS, specifically for the adaptive capture control.
Monitor Service Call Limit and Capture Rate
Some of the metrics described in the above blog post are also available and relevant in your SaaS tenant.
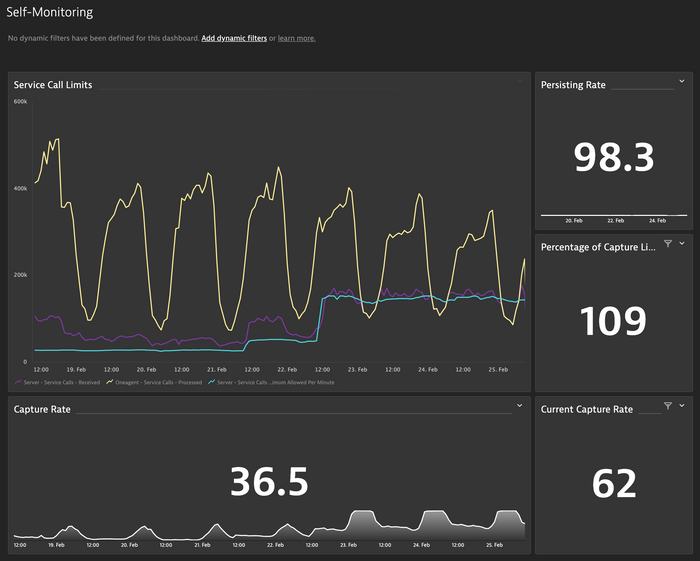
I'm using this dashboard to get an idea of the status of capture control in my SaaS tenant (dashboard is attached to this post):
What you can see in the above screenshots are the attempts to get back high fidelity data by improving the capture rate again.
What are we seeing there:
- The light blue line is the enforced capture limit for service calls. This defines how many service calls your SaaS tenant will process, based on your host unit license volume on your tenant
- The purple line is the number of service calls that your tenant received for processing.
- The yellow line is the number of service calls all your agents produce
Out of these metrics we can calculate the capture rate and how much of the limit we are consuming.
As you can see in the chart we have put some effort into increasing the capture rate, mainly by increasing the limit for this environment. We are not there at 100% but getting close now (we moved from 15% capture rate to 62% but will likely increase the limit a bit more).
But this is not the only strategy that you should follow! What else should you do?
Keep an eye on service call numbers!
It is very easy to just drop oneagents everywhere, enable istio/envoy tracing, define custom services and so on. But this can lead to lots of service calls, and sometimes you start tracing requests that you actually do not need or that do not provide any benefits. So generally you might want to consider these recommendations before blindly increasing the service call limit (which still might be required):
- Identify high-volume services:
You can use the multidimensional analysis to identify which services produce most calls and which calls these are. Try to identify noisy services and within these services high volume calls. - Exclude unnecessary global web requests:
You might have some requests that are not necessary to track at all. For those you can create a global exclusion rule so that they will not be traced at all, reducing your per-service call numbers.
Note that this exclusion rule is not available for all kind of services. - Careful with Istio/envoy meshes and ingress controllers:
When running in a K8s environment you might want to add your ingress controllers to Dynatrace. this makes perfect sense but it could add a lot of service requests (also some that are not related to the rest of your monitored environment). No. 2 applies for ingress controllers that support exclusions (e.g nginx).
If you are using istio/envoy and enabled support, unfortunately these exclusion rules have no impact. Consider removing some of the envoy ingress controllers from Dynatrace monitoring unless really needed. - Custom Services:
If you have lots of custom services definitions with high calls, rethink those if they are really necessary and keep an eye on them.
When applying these recommendations and you are still over the capture limit, you might have an architecture that is not well suited for the current implementation of capture control and might want to talk to your Dynatrace representative to make sure you can still get the best out of your data!(This only implies for SaaS - in Managed you can control these limits yourself).
Remarks
It is understandable that every SaaS solution has some "guardrails" to ensure an healthy operation. Such limits are necessary to avoid service quality drops due to "overloading". So it is a question of wise balancing.
While addressing this situation for one of my customers together with Dynatrace we found room for improvement and new features, but also the useful information for any Dynatrace user to keep an eye on their situation.
I hope this helps!
- Mark as New
- Subscribe to RSS Feed
- Permalink
25 Feb 2022 12:17 PM
This is awesome. I had one but was only the graph so thanks for doing this. Great work.
Featured Posts

