- Dynatrace Community
- Learn
- Dynatrace tips
- Service Level Objectives using "successful request count" for a specific API call
- Subscribe to RSS Feed
- Mark Topic as New
- Mark Topic as Read
- Pin this Topic for Current User
- Printer Friendly Page
Service Level Objectives using "successful request count" for a specific API call
- Mark as New
- Subscribe to RSS Feed
- Permalink
16 Dec 2020
02:25 PM
- last edited on
30 Aug 2022
12:44 PM
by
![]() MaciejNeumann
MaciejNeumann
Hi All,
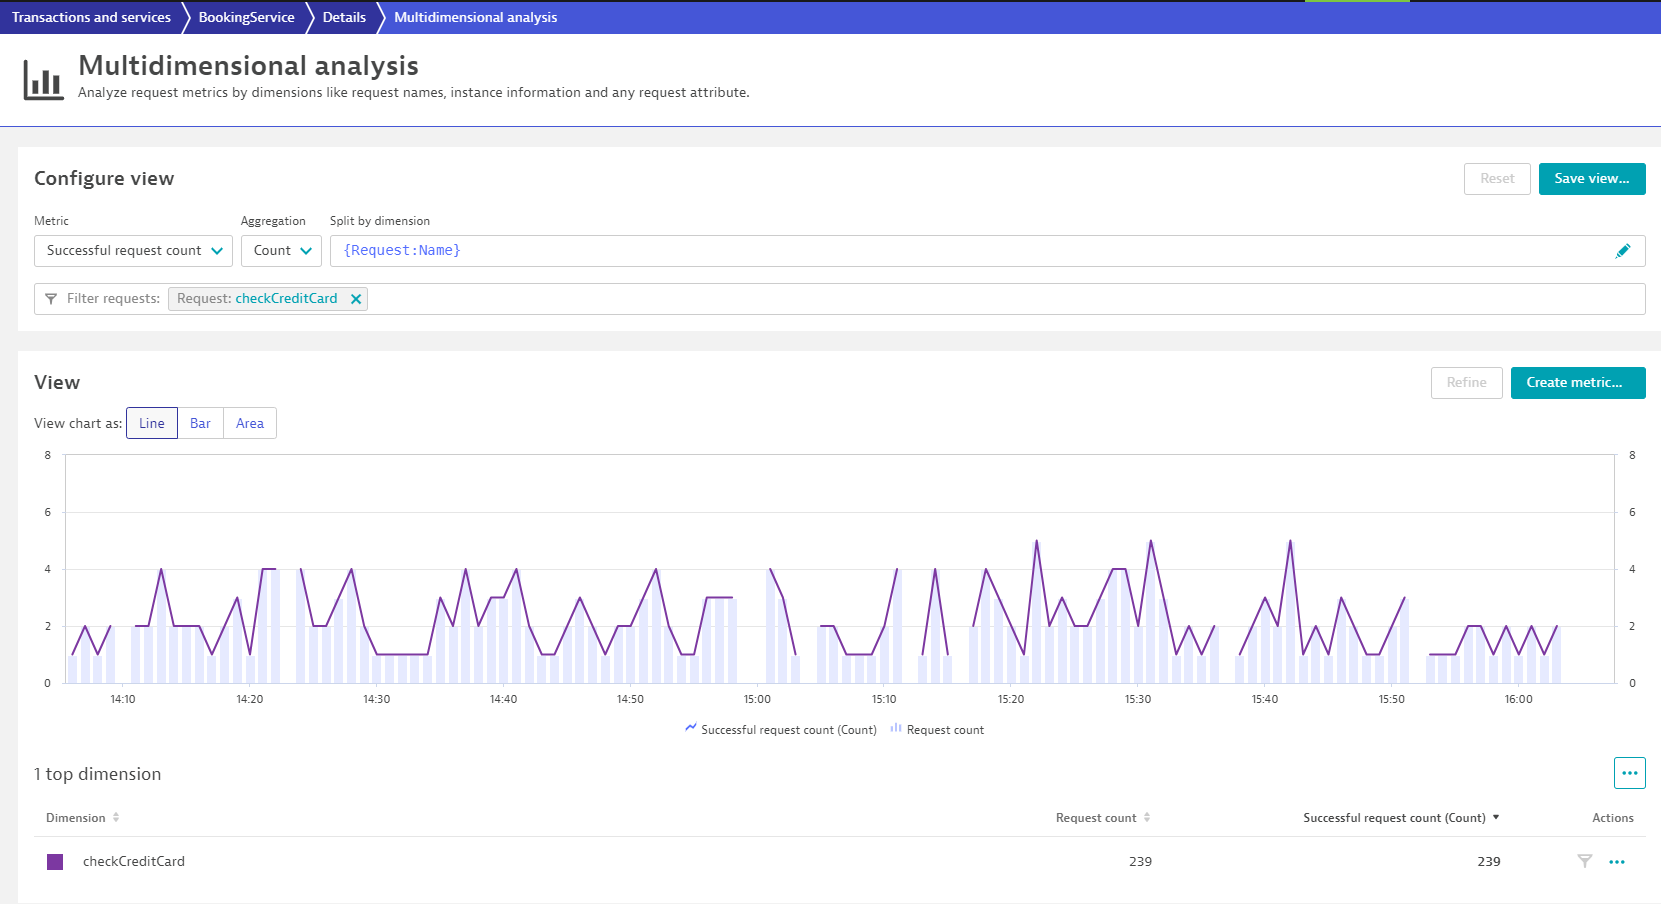
We've finally started to work with the long waited for SLO's and wanted to define one on the successful calls percentage of one of the API's. So we've opened the specific service and went into the "createa anlysis view", chose "successful request count" using the count aggregation for ths request and filtered to view only the single request we were interested in.
That was promising and showed us the right data so we went ahead and created the service metric for it.
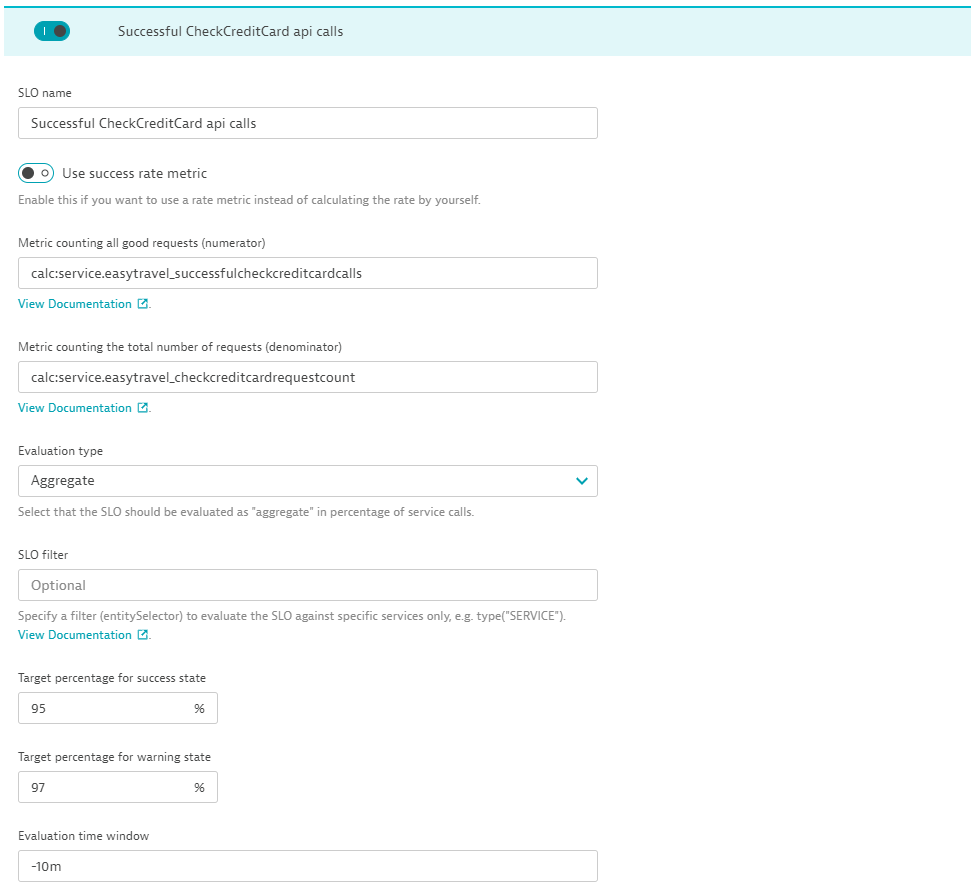
Once done (including creating a metric for the total number of calls, we went ahead and defined an SLO based on the ratio between what we thought would be the number of successfull cals and the total number of calls.
Imagine our surprise when we started to see the SLO measurements, knowing there were only few failures:
So we've started investigating. we've created charts to compare values. We've verified each configuration option. All was fine. Only after several hours I went into the new metrics page (thank you Dynatrace for that - It proved itself) and finally realized that the aggregation used is the default one, i.e. average.

This means that this specific metric will always have a value between 0 and 1 and SHOULD NOT be used for the ratio.What do we do now?
One option is to use this metric only as a success metric and define the success and warning level using values between 0 and 1. This works but seems odd to display as SLO tile shows the % sign next to it.
The other option, which we followed is to define the "successful requests" metric based on counting total requests but filtering this to only those with failed state is success. This gave us now the correct value and display

I hope this will save you some time in the future if you came across this issue.
- Mark as New
- Subscribe to RSS Feed
- Permalink
31 Dec 2020 09:36 PM
Thank you so much for sharing this!
Featured Posts
