- Dynatrace Community
- Ask
- Extensions
- Re: IBM MQ extension for One Agent Validation and log path
- Subscribe to RSS Feed
- Mark Topic as New
- Mark Topic as Read
- Pin this Topic for Current User
- Printer Friendly Page
- Mark as New
- Subscribe to RSS Feed
- Permalink
06 Oct 2021
11:54 PM
- last edited on
01 Apr 2025
09:44 AM
by
![]() MaciejNeumann
MaciejNeumann
I Configure the IBM MQ extension for OneAgent according to the documentation
However I do not see information about the queues or any error message in the extensions section, also verify that in the path: var / log / dynatrace / oneagent / extensions there is no log file. Could you advise me how to validate that this extension is working correctly or incorrectly?
After configurate the extension I restarted the Dynatrace OneAgent
I am interested to know if the extension was installed correctly or if it works well or badly regardless of its configuration. Or in which section of Dynatrace can I see the extension metrics working in case the configuration is correct?
I will thank you for any comments
Solved! Go to Solution.
- Labels:
-
extensions
-
IBM
-
ibm mq
-
oneagent
-
queues
- Mark as New
- Subscribe to RSS Feed
- Permalink
11 Jan 2022 10:57 AM
Hi all, does anyone have some ideas on tips on this subject? Big thanks in advance for any feedback!
- Mark as New
- Subscribe to RSS Feed
- Permalink
11 Jan 2022 11:00 AM
That extension was designed and built by @diego_morales. He'd be the best resource to help 🙂
- Mark as New
- Subscribe to RSS Feed
- Permalink
11 Jan 2022 12:42 PM
What is the extension version you are using currently? Please note that the MQ Extension was affected by log4j vulnerability, so make sure to run the most current version:
https://www.dynatrace.com/news/security-alert/log4shell-log4j-vulnerability/
- IBM MQ ActiveGate Extension
- Affected versions: 2.020.3 – 2.020.9
- Updated versions: >=2.020.10
I do have few AG running this extension. Do confirm if you can see the extension processes running on your AG, searching for the connector.jar, you should see at least one process by configured instance.
The logs should be on this dir:
/var/log/dynatrace/supportarchive/remotepluginmodule/log/remoteplugin/custom.remote.python.ibmmq_java
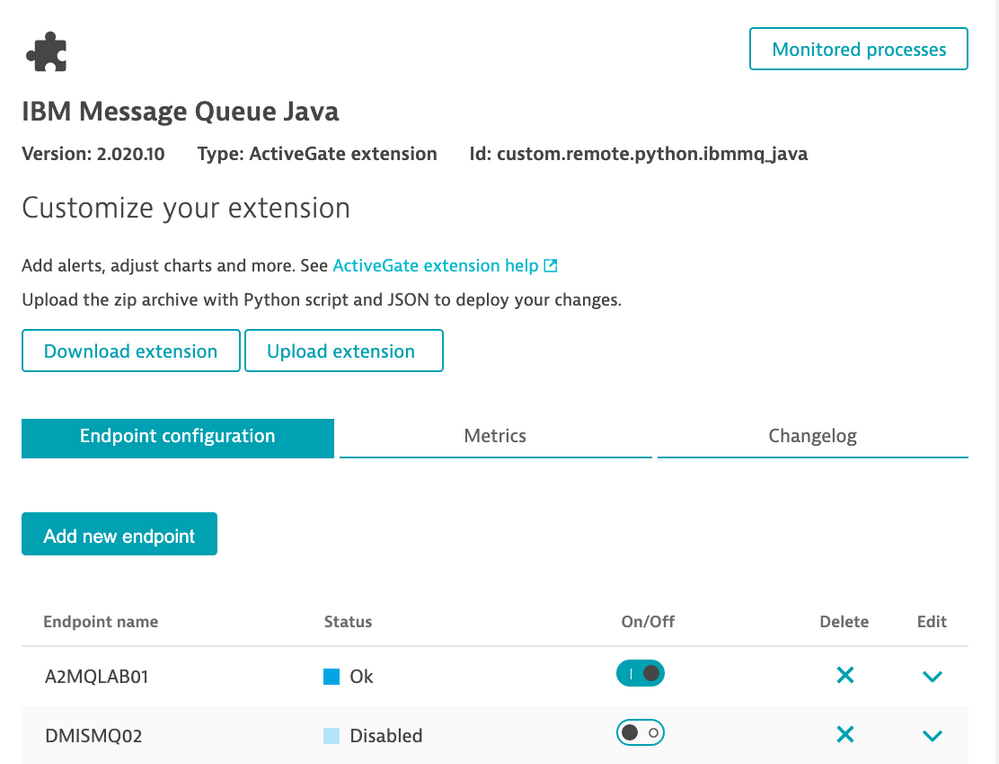
On Dynatrace UI, you can see the endpoint status on "Settings -> Monitoring -> Monitored technologies -> IBM Message Queue Java".
On the button "Monitored Process", you will see the MQ processes list, including the ones collected by the default OneAgents. For find out only the ones from the Extension, just check on the "Custom Devices" page.
Regards
Featured Posts

