- Dynatrace Community
- Ask
- Extensions
- OneAgent Plugin for browser process metrics
- Subscribe to RSS Feed
- Mark Topic as New
- Mark Topic as Read
- Pin this Topic for Current User
- Printer Friendly Page
- Mark as New
- Subscribe to RSS Feed
- Permalink
31 Jul 2024 05:44 PM
I am trying to make my first python extension. I am having trouble with the below plugin.py (keeps getting KeyError: 'results_builder'. I have not had much luck finding examples of what I want to do. Not really finding any doc out there on the ruxit.api I have easily built a similar script that uses the metrics API to ingest but trying to convert that to Oneagent Extension has been challenging. You can see I have been trying several iterations of invoking the self.results_builder*.
Solved! Go to Solution.
- Labels:
-
extensions
- Mark as New
- Subscribe to RSS Feed
- Permalink
31 Jul 2024 09:38 PM
@rseibert1 First of all - and that's most important, your example uses Extensions 1.0 which will be removed from Dynatrace this October.
Secondly, you are fetching regular process metrics (CPU/memory) which are available out of the box with OneAgent, also in Infrastructure mode. You might want to setup Declarative process grouping if your processes are "glued" together. If those metrics do not fit your use case or you want to have another data and this was just an example, have a look at Extension 2.0 , especially at WMI data source or at Python Data source.
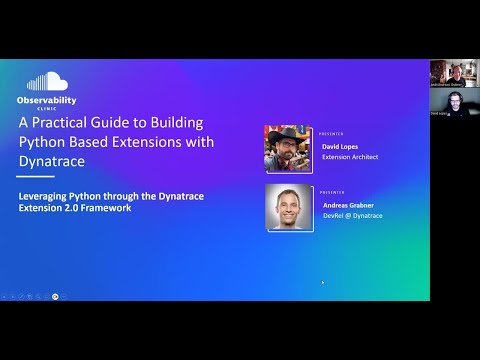
For Python, I'd recommend starting with this observability clinic - A Practical Guide to Building Python Based Extensions with Dynatrace.
- Mark as New
- Subscribe to RSS Feed
- Permalink
06 Aug 2024 01:49 PM
Thanks Julius for pointing me down the 2.0 path, I had looked into that earlier but for some reason I thought I could just convert to 2.0 later.
I have built a python extension in 2.0 format and it runs fine with the simulator, I am developing on a system that also has oneagent installed as well as the EEC enabled. When I upload and try to add a configuration for a specific host, I am lost on what to do for an endpoint as I want this to run locally so there is no endpoint/user/passwd configuration. Would I remove remote part of the activation from extension.yaml? Currently it has:
- Mark as New
- Subscribe to RSS Feed
- Permalink
06 Aug 2024 03:29 PM
You need to have activation in the extension. If this is a OneAgent extension only, you can remove the remote part - this is valid only for extensions executed by the ActiveGate. The extension must have some activationSchema which includes the extension configuration - you can remove all the configuration options in your activationSchema.json (when you generate the project, it generates something for you).
- Mark as New
- Subscribe to RSS Feed
- Permalink
15 Aug 2024 11:28 AM
It indeed doesn't support an empty schema. Whenever we need that we just add one dropdown for logging to make it easier to change the logging of the extension if you run into issues.
- Mark as New
- Subscribe to RSS Feed
- Permalink
06 Aug 2024 09:06 PM
I think if I am following you I can modify the activationSchema such that it will not require configuration after uploading?
In attempting to remove the config options I am getting the below error:
dtcli.utils.ExtensionValidationError: {"error":{"code":400,"message":"Activation schema error: Schema validation failed with Exception: 'No properties specified for complex type dynatrace.datasource.python:python_browser_metrics-localhost' in Schema 'template'."}}
The activationSchema.json is attached let me know what is missing?
- Mark as New
- Subscribe to RSS Feed
- Permalink
06 Aug 2024 10:41 PM
TBH I'm not sure if the schema allows such an empty configuration. Unfortunately, there is no public doc for the activation schema. Maybe @Mike_L or @david_lopes can help here.
- Mark as New
- Subscribe to RSS Feed
- Permalink
21 Aug 2024 11:16 PM
i normally leave the default alone, just add your own configuration after the default in activationschema. If doing local oneagent extension, add your logic in _main_.py. After deployed, they are on the configuration page, and you can enter garbage there as endpoint, and it just does not do anything.
Featured Posts

