- Dynatrace Community
- Ask
- Extensions
- Spark monitoring through custom JMX plugin
- Subscribe to RSS Feed
- Mark Topic as New
- Mark Topic as Read
- Pin this Topic for Current User
- Printer Friendly Page
- Mark as New
- Subscribe to RSS Feed
- Permalink
04 Sep 2018 08:49 AM
Hi guys,
We are using Yarn as cluster manager so Dynatrace out of the box monitoring is not working for our use case as it only supports Stand Alone Cluster.
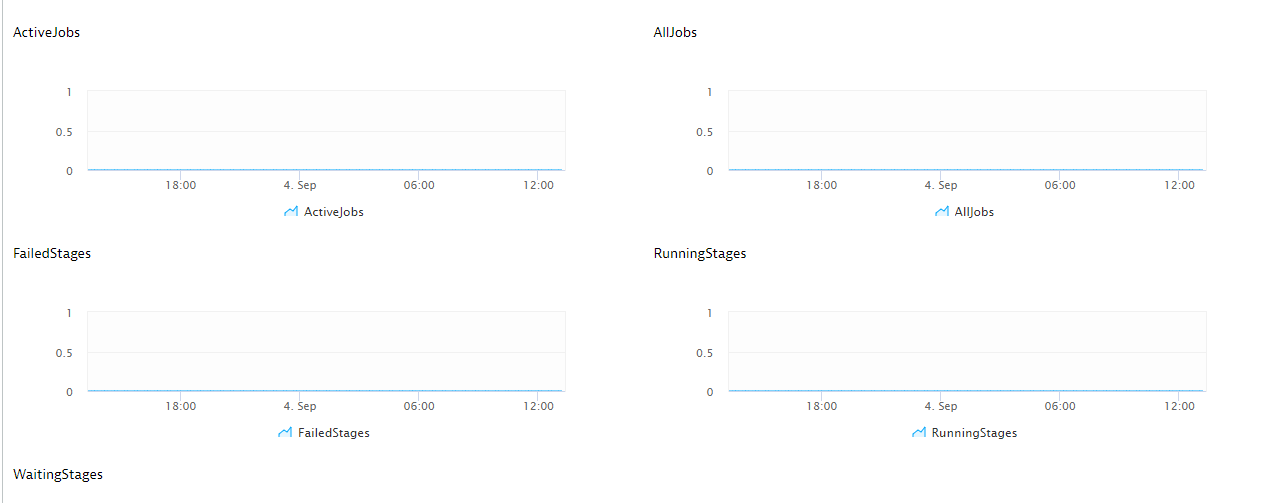
We created JMX plugin through plugin editor. we have added few metrics to see if it works. Sadly it is not capturing any data. We run Spark job for testing but no luck.
Following are the Mbeans we are using. They are already exposed.
driver.DAGScheduler.job.activeJobs
driver.DAGScheduler.job.allJobs
driver.DAGScheduler.stage.failedStages
driver.DAGScheduler.stage.runningStages

Could anyone help here. Do we need to do some other configuration in order to pic these metrics
Solved! Go to Solution.
- Labels:
-
extensions
- Mark as New
- Subscribe to RSS Feed
- Permalink
04 Sep 2018 09:16 AM
Hi
When you see charts like this, it doesn't mean that Dynatrace OneAgent did not captured any data, but it captured something with value equal 0. I assume that if you would connect to this process by for example JConsole you would see values other than zero and that the problem here.
I think that plugin could be wrongly configured. It can be for example source aggregation issue, if your process exposes selected attribute by more MBeans that matches key properties defined in plugin in source section. Dynatrace OneAgent also captures data every 10 sec, but aggregates values per minute.
Be careful with options calculateDelta and calculateRate, these options have specific usage.
See our github help page here: https://github.com/Dynatrace/JMX-Extensions
It could be helpful for you to know what fields do what.
I would recommend you to download your plugin created by creator (you can do this by finding your plugin in custom extensions tab in settings, going into its details, and there should be download plugin button), and try to edit some options manually by editing json file and then re-uploading it. Some options can not be changed because it would corrupt continuity of your data so if you will came across that case just rename your plugin with changing some UI fields just for you to distinguish data from both plugins and upload it again.
- Mark as New
- Subscribe to RSS Feed
- Permalink
04 Sep 2018 10:48 AM
Hi Sebastian,
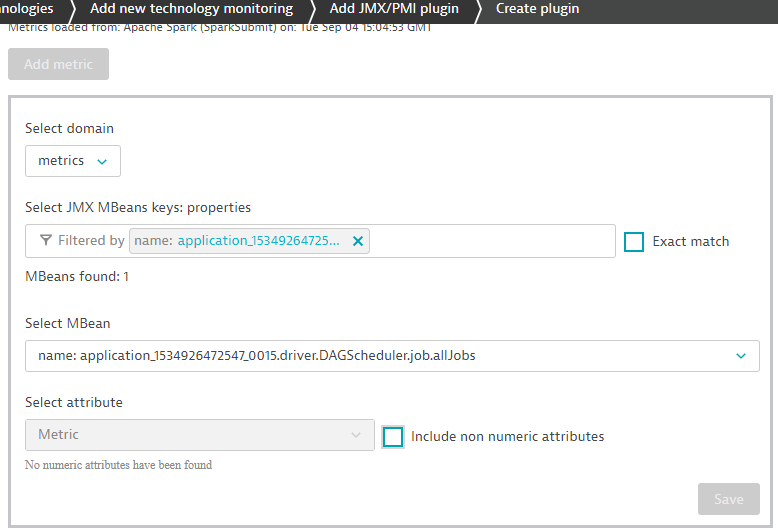
I think you are right, I might have not define the plugin correctly. Following way I define this. The "Select Attribute" tab was grayed so I choose include non numeric metric. This gave me warning in Yellow.
See the below screenshots. Could you please suggest what is wrong here


- Mark as New
- Subscribe to RSS Feed
- Permalink
04 Sep 2018 01:40 PM
If you see such warning there can be nothing wrong 🙂
Including non numeric attributes results in extending available attributes list. It adds to this list also attributes which type is not numeric, that is for example java.lang.String or java.lang.Object. Dynatrace OneAgent will try then parse those attributes to Double.
User can select that attribute, and plugin will be created with this metric, but if such attribute that is in fact String will not return values that are parsable to Double, metric will not collect any data and will not be visible anywhere.
Featured Posts
