- Dynatrace Community
- Dynatrace
- Ask
- Open Q&A
- Re: Can we get HTTP500 errors in the Problem Overview?
- Subscribe to RSS Feed
- Mark Topic as New
- Mark Topic as Read
- Pin this Topic for Current User
- Printer Friendly Page
Can we get HTTP500 errors in the Problem Overview?
- Mark as New
- Subscribe to RSS Feed
- Permalink
04 May 2023
02:49 PM
- last edited on
09 May 2023
09:52 AM
by
![]() MaciejNeumann
MaciejNeumann
We have Dynatrace Managed and currently, one of our applications is having quite some HTTP 500 errors. These are visible when you view the application overview page, but we want to see them as open problems in the Problem overview. Is that possible?
We are monitoring the application via manually injected.
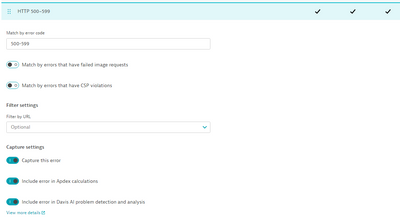
If it is possible, how do you set it up? We did configure the error detection for HTTP 5xx errors as followed:
However, we still don't see open problems in the Problem overview.
If it is not possible, is there another way to quickly get notified by the amount of HTTP500 errors for this application?
- Labels:
-
problem detection
-
problems classic
- Mark as New
- Subscribe to RSS Feed
- Permalink
04 May 2023 03:57 PM - edited 07 May 2023 11:27 AM
Hi @MartijnA,
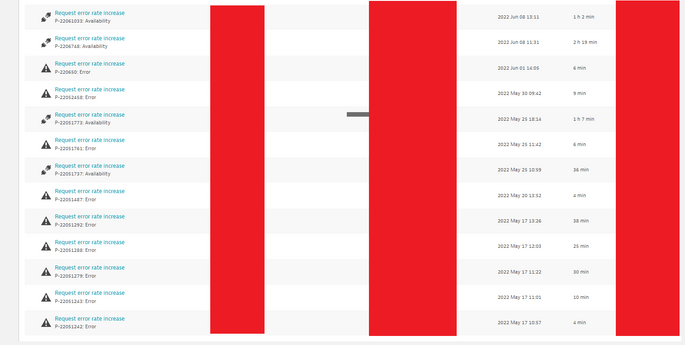
I have checked one managed environment and I can see failure rate problems for web apps.
With this content:
Maybe the frequent issue detection block to open new problem but it is a "weak" assumption.
In worst case scenario you should create a metric for request errors at the app and then a metric events with a statis threshold strategy for the new metric.
I hope it helps.
Best regards,
Mizső
- Mark as New
- Subscribe to RSS Feed
- Permalink
05 May 2023 02:39 PM
Hi Mizso,
Thank you for your reply!
Does 'Request Error Rate Increase' still exist currently? In your screenshot I see the year 2022 and online I cannot find it, only 'JavaScript Error Rate Increase'.
Is there currently no other way of showing (many) HTTP 5xx errors as (new) problems in the Problem Overview other than by creating custom alerts?
- Mark as New
- Subscribe to RSS Feed
- Permalink
05 May 2023 06:53 PM
Hi Martijn,
That's a very good question, something I've been wondering as well. I agree with your view that the error rate problems based on RUM data were something of the past, but currently we are not seeing them. That was basically a new feature that existed for a certain period of time and was then rolled back. When you go to anomaly detection for web apps, it only gives you the option to configure JavaScript error rate alerts, but not http errors. So yes, I think currently you'd need to define a custom alert a.k.a. metric event about it.
It would be interesting to hear from someone who knows more about this, and especially how/why those error rate alerts for web apps appeared and then disappeared.
- Mark as New
- Subscribe to RSS Feed
- Permalink
08 Jun 2023 03:40 PM
I think I read somewhere that this is actually a GUI text thing (omission), and that where it states JavaScript error rate alerts, this actually also applies to HTTP or even all errors, and thus the text should be updated.
Hang on, I even found the discussion here:
Solved: How to configure application HTTP error rate alerts? - Dynatrace Community
- Mark as New
- Subscribe to RSS Feed
- Permalink
08 Jun 2023 03:44 PM
Yeah but the comment you're referring to is from 2021 - that was maybe how it worked 2 years ago, but not anymore. Currently we do not get automatic problem detection for RUM http errors.


