- Dynatrace Community
- Ask
- Open Q&A
- Re: Connectivity Host vs. Processes
- Subscribe to RSS Feed
- Mark Topic as New
- Mark Topic as Read
- Pin this Topic for Current User
- Printer Friendly Page
- Mark as New
- Subscribe to RSS Feed
- Permalink
12 Sep 2021
03:59 PM
- last edited on
28 Sep 2022
10:28 AM
by
![]() MaciejNeumann
MaciejNeumann
Dear All,
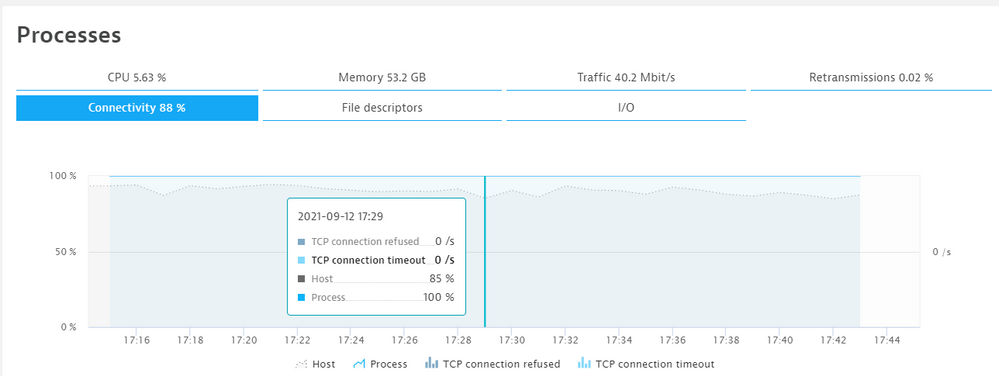
The following screenshot shows 100% connectivity on the process (all the processes connectivity is 100%) level but 85% on the host level.
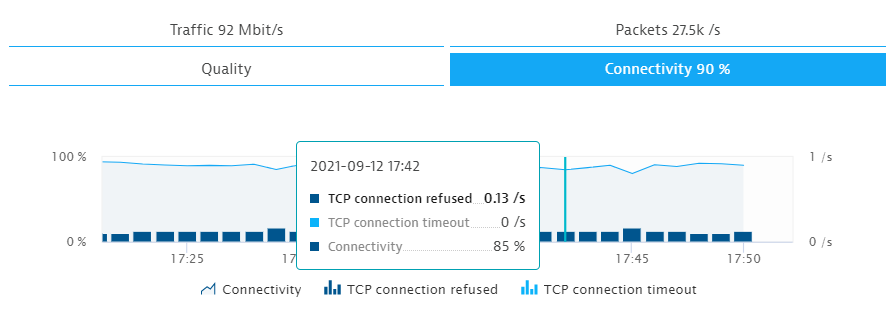
The below screenshot is from the same host with the TCP connection refused.
What could be the reason behind this mismatching data?
Regards,
Babar
Solved! Go to Solution.
- Labels:
-
hosts classic
-
process groups
- Mark as New
- Subscribe to RSS Feed
- Permalink
12 Sep 2021 06:39 PM
Connection refused happen due to the lack of a process listening on a port that a client has specified, so unfortunately this situation is quite normal. It would be awesome if we one day provide client IP and port information for connection refused…
- Mark as New
- Subscribe to RSS Feed
- Permalink
13 Sep 2021 07:00 AM
Hello @dave_mauney
Thank you for your comments.
Do you mean there is another process that is not detected by the Dynatrace?
and the TCP connection refused belong to that process?
Regards,
Babar
- Mark as New
- Subscribe to RSS Feed
- Permalink
13 Sep 2021 07:17 PM
No, my contention is that there is no process on the monitored host that is listening on the port being called. Since we don't provide the client IP or port, we cannot really do much more with these in Dynatrace, but you could use other tools to find out what IP(s) and port(s) are attempting to make these connections.
- Mark as New
- Subscribe to RSS Feed
- Permalink
14 Sep 2021 07:14 AM
Hello @dave_mauney
Thank you. I try to find a way to use some other tools as you suggested.
Regards,
Babar
- Mark as New
- Subscribe to RSS Feed
- Permalink
13 Sep 2021 06:58 AM
I interpret this to mean that a TCP port (or ports) is being called on that host, but the port is not being listened to by any of the running processes. Thus, we can't say that any of those listed processes are refusing that connection, since they're not listening to that port in the first place.
You could see this e.g. if a load balancer has a health check configured for a port that's no longer used. It would keep the host's connectivity below 100 %, but it wouldn't affect any specific process.
- Mark as New
- Subscribe to RSS Feed
- Permalink
13 Sep 2021 07:11 AM
Hello @kalle_lahtinen
Do you mean that in past someone requested to open the port from any source to this perticular host and now no process is listening on that port?
Regards,
Babar
- Mark as New
- Subscribe to RSS Feed
- Permalink
13 Sep 2021 07:26 AM
No, it means that a TCP connection was attempted on this host, but the specific port used in the connection is not being listened to on that host.
You should basically be able to lower a host's TCP connectivity metric by just manually running tests for random ports that are not being used. So just pick a port that's not being listened to (you can double check that via netstat) and then run e.g. "curl MyHostName:53777" from a remote server. In the example I chose port 53777 as one that probably wouldn't be used.
Btw note that if there's a firewall blocking the connection between your remote server and the host with OneAgent running, that test above would never even end up on the server. So in order for the host connectivity percentage to go down, the TCP call does have to actually arrive on that host.
- Mark as New
- Subscribe to RSS Feed
- Permalink
14 Sep 2021 07:16 AM
Hello @kalle_lahtinen
Let me check through SolairWinds or any other network tool to understand who is calling which port with the 100% failure rate.
Regards,
Babar
Featured Posts


