- Dynatrace Community
- Ask
- Open Q&A
- Re: DB Locks, Blocking etc
- Subscribe to RSS Feed
- Mark Topic as New
- Mark Topic as Read
- Pin this Topic for Current User
- Printer Friendly Page
- Mark as New
- Subscribe to RSS Feed
- Permalink
14 Oct 2018 02:12 AM
Hello,
We have a shared MS SQL Server 2012 with over 20 databases running. We have the OneAgent running as Infrastructure monitoring mode. We get helpful information from the Host level - I would like to get much deeper understanding of the Locks page is - How would I know the locks shown represents which DB.
Thank you
MRC
Solved! Go to Solution.
- Mark as New
- Subscribe to RSS Feed
- Permalink
20 Jul 2020 04:16 PM
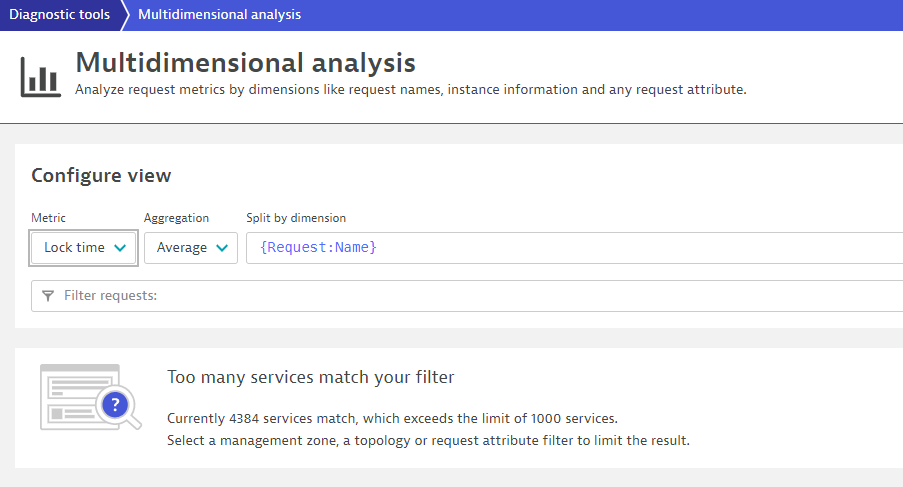
you can do this via the Multidimensional Analysis chart - let me know if you need any assistance setting this up:

- Mark as New
- Subscribe to RSS Feed
- Permalink
20 Jul 2020 04:52 PM
@Chad T. Thank you for looking into my post and responding. I would love to see if you can provide more details. Thank you once again!
- Mark as New
- Subscribe to RSS Feed
- Permalink
20 Jul 2020 04:57 PM
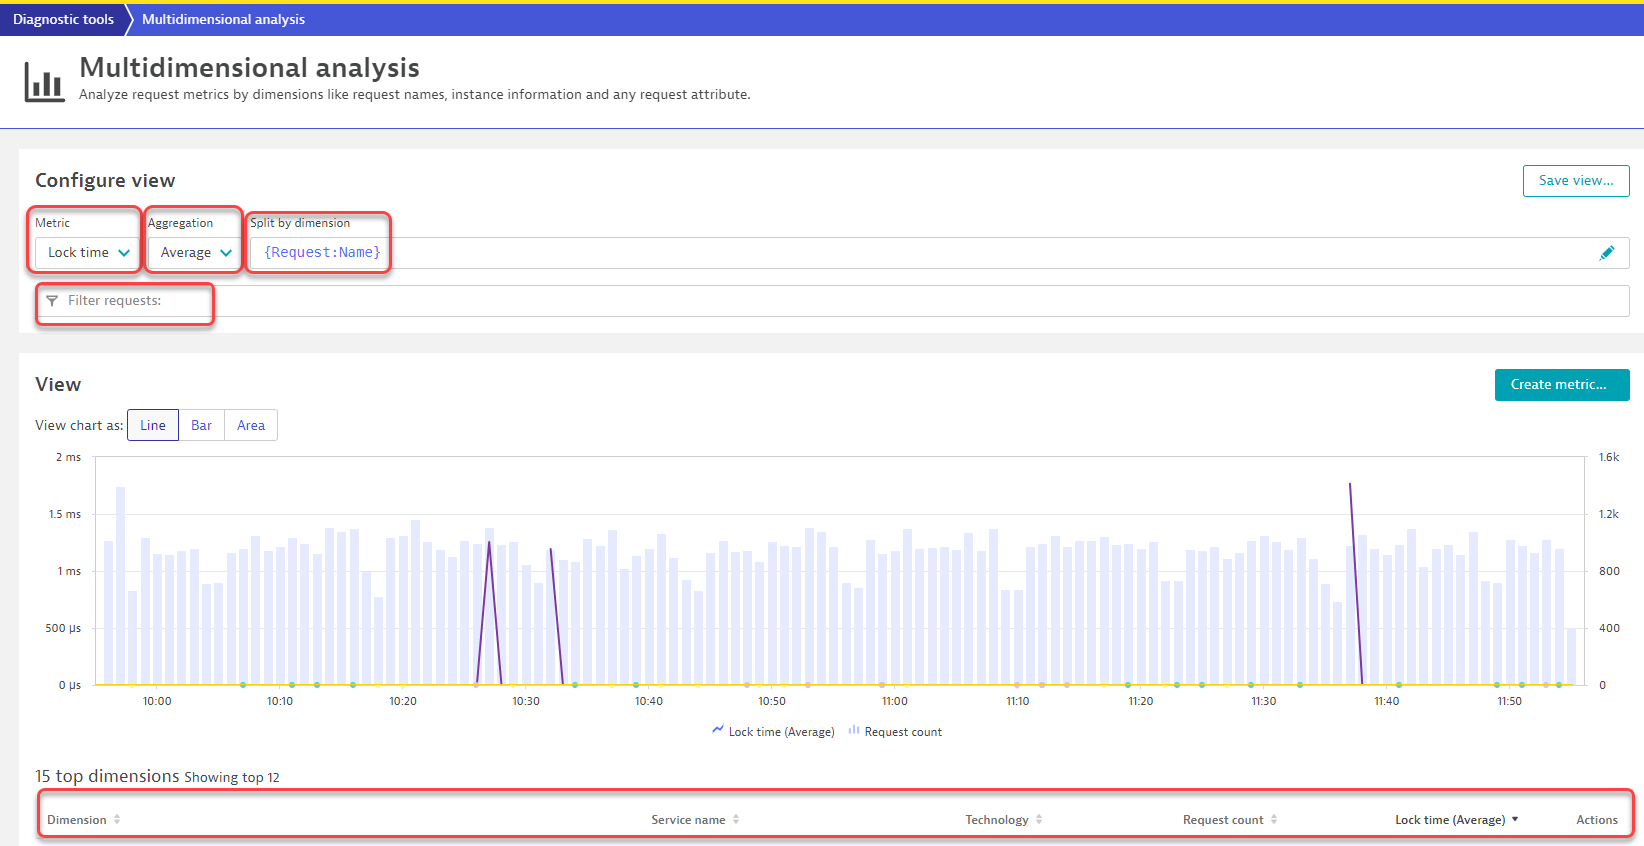
so you might need to go full stack for full monitoring, but go to Diagnostic tools, and select "Create Analysis View"

From there select the metric you are interested in, the aggregation and the dimension if need and you can also filter the results if you are not using management zones.

- Mark as New
- Subscribe to RSS Feed
- Permalink
22 Jul 2020 02:51 PM
Thank you for sharing the details. We would like to be on the Infrastructure as these servers could exceed 64GB RAM which doesn't meet the ROI for the licenses. We are looking at building a custom plugin that will pull the details. Thank you for your help though
- Mark as New
- Subscribe to RSS Feed
- Permalink
22 Jul 2020 04:49 PM
understandable - you might still be able to do this at an infrastructure only level but im not 100% sure. WE all have been there trying to get the host out of our host units
- Mark as New
- Subscribe to RSS Feed
- Permalink
27 Jul 2020 12:58 PM
Are you aware of the 1 Host Unit cap on Infrastructure only agents? You should verify with your sales contact to see if this can help.
- Mark as New
- Subscribe to RSS Feed
- Permalink
27 Jul 2020 03:22 PM
Thank you - yes we are aware of 1 host unit cap on the Infrastructure mode regardless of the amount of memory allocated.
- Mark as New
- Subscribe to RSS Feed
- Permalink
08 Oct 2024 08:18 AM
Hii ChadTurner,
I want blocked query metrics for database , can you please tell me the path to get blocked queries .
Regards,
Prithvi
- Mark as New
- Subscribe to RSS Feed
- Permalink
27 Jul 2020 06:07 PM
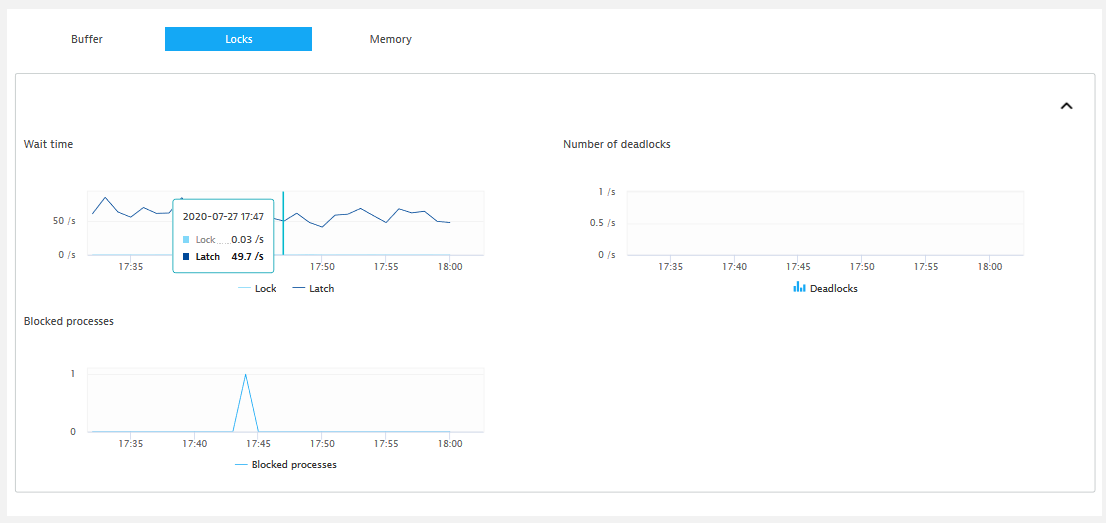
When you are talking about SQL Server DB locks, I believe you are talking about this screen:

The locks in this screen are not related to the locks that are available in Dynatrace, namely through Method Hotspots. It would be great though to have more details in which DB invocations are involved in these locks.
- Mark as New
- Subscribe to RSS Feed
- Permalink
28 Jul 2020 02:30 AM
@Antonio S. Yes I am referring to this page. We have multiple COTS products where we can’t instrument via OneAgent. We need to monitor the DB systems and we need different monitoring software.
- Mark as New
- Subscribe to RSS Feed
- Permalink
21 Oct 2024 07:13 AM
You may wish to look into the sqlserverreceiver of the OpenTelemetry collector.
Featured Posts
