- Dynatrace Community
- Ask
- Open Q&A
- Re: Disk I/O on AIX Hosts
- Subscribe to RSS Feed
- Mark Topic as New
- Mark Topic as Read
- Pin this Topic for Current User
- Printer Friendly Page
- Mark as New
- Subscribe to RSS Feed
- Permalink
17 May 2021 08:04 AM - last edited on 18 May 2021 10:02 AM by laima_vainina
Dear All,
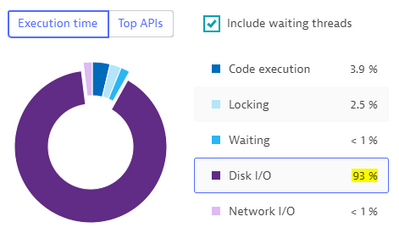
We are facing a slowness on one of the applications during the stress testing. On the analysis, we found that the maximum contribution is from disk I/O.
How to interpret the disk I/O on the host?
What could be the reason behind a huge disk I/O?
Regards,
Babar
Solved! Go to Solution.
- Mark as New
- Subscribe to RSS Feed
- Permalink
17 May 2021 09:57 PM
Hello @Babar_Qayyum ,
based on the screenshot it looks you are looking at method hotspots. There are two important points here for an interpretation of the results:
- be sure to have a large sample of the relevant stack frames (it shows the number). If it's low (low is below 100), it's likely not very precise, but it depends on various conditions.
- Disk IO typically means the application is using either disk operations or even some network operations that may be represented as disk io (I've seen such cases with jdbc drivers)
In other words - the code was waiting for input from a disk. You will need to look for the hotspots classes and methods in Method hotspots view to figure out what is really going on.
- Mark as New
- Subscribe to RSS Feed
- Permalink
18 May 2021 07:11 AM - edited 18 May 2021 08:43 AM
Hello @Julius_Loman
Thank you for your comments.
The following is one of the stress tests for a few minutes and below is the behavior of Disk I/O.
The following are the top hotspots.
Wherever is the high Disk I/O, there I see the following message in the PurePaths?
Regards,
Babar
- Mark as New
- Subscribe to RSS Feed
- Permalink
18 May 2021 09:33 AM
It's load test - it's fine you see purepaths errors and it's expected.
The hotspots are obvious, the code is getting file information (attributes/last modifications). You will need to browse the code to identify it. You will need to understand what the application should do and maybe the application is inefficiently doing some operations on filesystem. It's not possible to tell from the the screenshot you pasted, but definitely it's filesystem operations. It's for example possible there are just many files and the code is looping through them.
- Mark as New
- Subscribe to RSS Feed
- Permalink
18 May 2021 02:35 PM
Hello @Julius_Loman
I shared the source code with the developers. How do you see the below-highligted method using enormous Disk I/O?
Regards,
Babar
- Mark as New
- Subscribe to RSS Feed
- Permalink
18 May 2021 07:49 PM
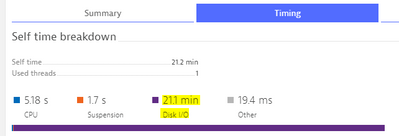
This is a screenshot from a single PurePath in Code-Level tab. Here it only shows "instrumentation points". Thus this is not visible here and you can only see the GAP.
You must look the calling code in the method hotspots. Either for this single PurePath or for a set of requests. If you have enough samples in the method hotspots, you can clearly see the stackframes and the class/method responsible for the issue.
Featured Posts


