- Dynatrace Community
- Ask
- Open Q&A
- Re: Does Dynatrace support Apache Camel?
- Subscribe to RSS Feed
- Mark Topic as New
- Mark Topic as Read
- Pin this Topic for Current User
- Printer Friendly Page
- Mark as New
- Subscribe to RSS Feed
- Permalink
14 Nov 2018 03:05 PM
Hello,
I have a customer which uses a Talend application. This basically uses Karaf as an entry point, Apache Camel as an middle layer (for routes and services) and plain java for job execution.
At the moment we are only seeing the Karaf and Java part. I have tried implementing custom service detection rules for the Routes and Services (Apache Camel), but this provides only the entry points and no further insights into DB queries, ...
Any previous experiences with Apache Camel would be much appreciated
Best regards,
Koen
Solved! Go to Solution.
- Labels:
-
apache
- Mark as New
- Subscribe to RSS Feed
- Permalink
14 Nov 2018
03:52 PM
- last edited on
31 Dec 2024
11:37 AM
by
![]() MaciejNeumann
MaciejNeumann
I'm pretty sure I have seen Apache Camel at a customer before, where we had full visibility for the Camel Routes, not only an Entry Point.
But it seems other community members had issues with linking the Camel PurePath aswell.
- Mark as New
- Subscribe to RSS Feed
- Permalink
14 Nov 2018 04:15 PM
Hello Patrick,
Do you remember whether you used specific entry points, or did anything else to "enable" support for Camel?
Best regards,
Koen
- Mark as New
- Subscribe to RSS Feed
- Permalink
04 Jul 2019 12:52 PM
Hello,
any news/update on this ?
Regards,
Jody
- Mark as New
- Subscribe to RSS Feed
- Permalink
04 Oct 2021 08:24 AM
Actually, there is a solution. We have been facing the same problem in monitoring an application with Camel integrated. We couldn't see the full Pure Paths as well as the full detailed Service Flow.
We could solve the problem through using Camel with integrated Opentracing. Dynatrace offers One Agent Settings that allow to monitor Applications with Opentracing and Opentelemetry. You will have to activate some settings (according to your environment) as shown in the following Screenshot:
After activating those, you'll be able to see fully detailed Pure Paths and Service Flow. See the example below. For demonstrating purposes we sent a request from a Spring Boot Client through 2 Camel Services -both with the camel-opentracing-starter- to a NodeJS server and got a response the same way back:
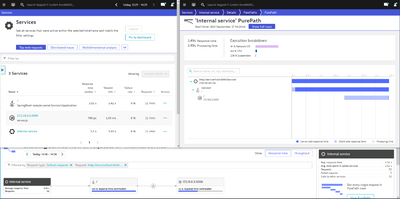
Without active Opentracing Monitoring:
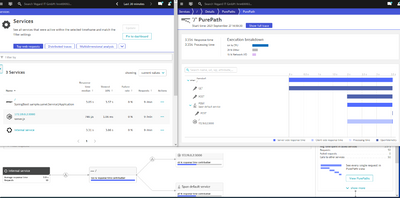
Active Opentracing Monitoring:
Further on it is important to not let Camel filter out -depending on your configuration- the Dynatrace or Opentracing header.
Featured Posts


