- Dynatrace Community
- Ask
- Open Q&A
- Re: Dynamic Web Request and Resource Requests - Dynatrace SaaS
- Subscribe to RSS Feed
- Mark Topic as New
- Mark Topic as Read
- Pin this Topic for Current User
- Printer Friendly Page
- Mark as New
- Subscribe to RSS Feed
- Permalink
21 Apr 2017
09:10 AM
- last edited on
21 Dec 2023
11:53 AM
by
![]() MaciejNeumann
MaciejNeumann
Hi,
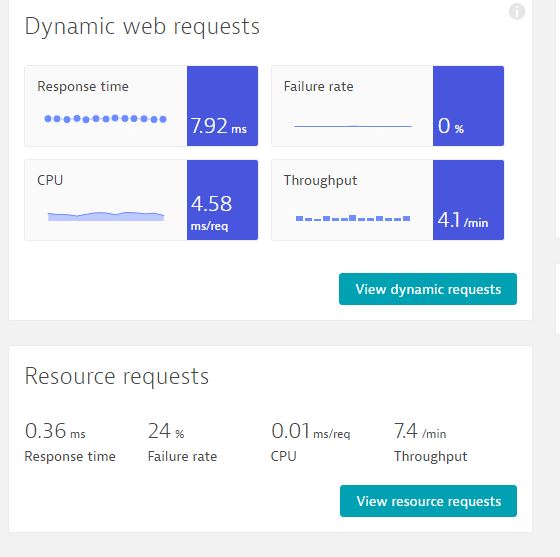
I am using Dynatrace SaaS, in that i noticed that below screenshot. In that dynamic web request and Resource request showing when we see the details of particular process running in the host.
Both shows different values for Response Time, Throughput, CPU and Response Time.
How is calculated for these metrics for these 2 request type. How it will be helpful for our analysis. Anyone help me to understand. Thanks in advance!

BR
Soorya Mohan
Solved! Go to Solution.
- Labels:
-
request attributes
- Mark as New
- Subscribe to RSS Feed
- Permalink
15 May 2018 01:53 AM
It looks like the View Resource Requests shows you all resources needed to create the web page such as jpg files, css, etc. However, I noticed these two selections (i.e. View Resource Requests/View Dynamic Requests) are only available when the service is something like an apache server (for example webrp0335:8080). However, when the service is an actual service (for example UserValidationService) you do not get either of those buttons. Instead you get a View Request button.
I think if the discussion could continue in terms of the difference between: View Dynamic Requests vs View Requests, this would be helpful for both Soorya and I.
And also in addition could someone help me why webrp0335:8080 is being considered a service. If I click on Dynamic Request from it I will see many request types none having to do with simply hitting webrp0335:8080?
Thanks,
David
note: I will submit that last question in a separate forum so it gets some visibility on its on merits.
- Mark as New
- Subscribe to RSS Feed
- Permalink
11 Jul 2019 02:28 AM
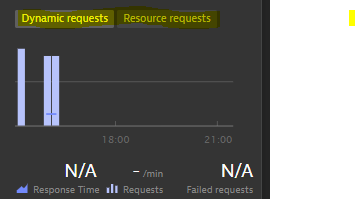
I am looking for same answer... i see this info in the last tiles when i pin a service to a dashboard:

- Mark as New
- Subscribe to RSS Feed
- Permalink
04 Jun 2024 07:32 AM
Haris Hibic
Featured Posts
