- Dynatrace Community
- Ask
- Open Q&A
- Re: Dynatrace Fullstack monitoring
- Subscribe to RSS Feed
- Mark Topic as New
- Mark Topic as Read
- Pin this Topic for Current User
- Printer Friendly Page
- Mark as New
- Subscribe to RSS Feed
- Permalink
15 Nov 2023 02:31 PM
Dear Team,
We are using Dynatrace SaaS post installing and enabling fullstack monitoring for one of EC2 instance which is hosting MSSQL.
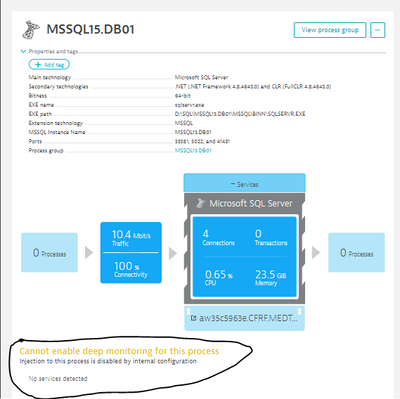
Getting Infor like "Cannot enable deep monitoring for this process"
Attaching screenshot for your reference and kindly suggest how we will fix this?
Thanks and Regards,
Dharmender Singh
Solved! Go to Solution.
- Mark as New
- Subscribe to RSS Feed
- Permalink
15 Nov 2023 02:34 PM
That's correct, deep monitoring does not work for Microsoft SQL Server. Metrics are collected also in infrastructure mode and you can see distributed traces from your applications. If the host does not contain any other applications which can be deep monitored, it's worth switching it to infrastructure mode.
- Mark as New
- Subscribe to RSS Feed
- Permalink
15 Nov 2023 02:57 PM
Hello,
Further to this. If you're looking to see the DB statements that are being run on the SQL Server DB Process then you will need to deploy the Agent in Full Stack mode on the calling application. Dynatrace will then inject into the DB connection library and create a DB Service based in this data. Then under that Service you will see the SQL Statements showing up as requests.
- Mark as New
- Subscribe to RSS Feed
- Permalink
15 Nov 2023 06:05 PM
Hi @dharm_0101,
Agree with @Julius_Loman and @D_Miller, but If you would like other MSQSL operation metrics you can use this extensions:
In case of OA installed on VM (released in this October): Microsoft SQL Server (local) monitoring & observability | Dynatrace Hub
Without installed OA on the VM, remotly from Environment Activegate: Microsoft SQL Server monitoring & observability | Dynatrace Hub
I hope it helps.
Best regards,
Mizső
Featured Posts

