- Dynatrace Community
- Dynatrace
- Ask
- Log Analytics
- Dynatrace showing only 100 hosts or 100 process groups in Log sources and storage
- Subscribe to RSS Feed
- Mark Topic as New
- Mark Topic as Read
- Pin this Topic for Current User
- Printer Friendly Page
Dynatrace showing only 100 hosts or 100 process groups in Log sources and storage
- Mark as New
- Subscribe to RSS Feed
- Permalink
01 Dec 2022
12:30 PM
- last edited on
19 Jun 2023
12:10 PM
by
![]() Karolina_Linda
Karolina_Linda
Having more than 100 hosts that all have logs, when I go to Manage |> Settings |> Log Monitoring |> Log sources and storage, I only see 100. If I filter on a hostname that isn't listed, but still exists in the Infrastructure |> Hosts list, then I can see the logs discovered.
If I switch to the Process groups perspective, then I can only see 100 processes listed in what I assume to be alphabetical order, the last of which starts with M. If I filter on process name "Windows", then I get "Windows Operating System", which didn't show among the first 100.
I expect there should be pagination on this, but apparently that is not the case.
Furthermore, when I filter on anything, then the result is expanded, which I find a nuisance as there is no quick way to collapse them all.
While trying to get the full list of hosts by applying filters, it seems I'm not able to add a negation, which would be quite nice.
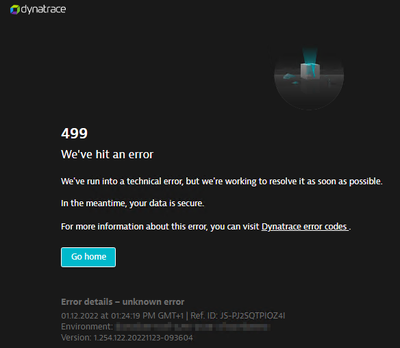
The only error on the page, that I can find in the browsers developer tools is 500 Internal server error on trying to access the REST endpoint for chat-access. Funny part is, that if I click on the link in the JavaScript Console, then I get a 499 page
- Labels:
-
log monitoring classic
-
settings
- Mark as New
- Subscribe to RSS Feed
- Permalink
01 Dec 2022 02:51 PM
Hi @perholst ,
Which DT servers version do you have? Which version of Log Monitoring do you use v1 or v2?
Best regards,
Mizső
- Mark as New
- Subscribe to RSS Feed
- Permalink
05 Dec 2022 10:30 AM - edited 05 Dec 2022 10:30 AM
Hi @perholst ,
If it is possible upgrade to v2. Log souce configuration is rule based and much more flexible. I guess v1 functions will not be "corrected" and developed in the future.
Best regards,
Mizső
- Mark as New
- Subscribe to RSS Feed
- Permalink
06 Dec 2022 07:35 AM
Hi @Mizső,
If I was guaranteed that migrating to Log Monitoring v2 would solve the issue of the view, then maybe. But as there is no way to revert back to Log Monitoring v1, then I'm a bit apprehensive to suggest this as the way forward.
The Log Monitoring |> Log sources and storage should be version agnostic, so I'm not sure this is the real problem.
Best regards,
Per
- Mark as New
- Subscribe to RSS Feed
- Permalink
06 Dec 2022 07:30 AM
Hi @Babar_Qayyum,
No, the bottom of the page shows
So - as I stated originally - I expect there should be pagination on this. And it seems that you have. Then maybe it is Managed? The Javascript error? The version 1 of Log Monitoring? In any case - it's buggy 🙂
Regards,
Per
- Mark as New
- Subscribe to RSS Feed
- Permalink
06 Dec 2022 09:23 AM
Hello @perholst
It seems really strange because the information was taken from the same Managed version. Because you are facing the situation for both hosts and processes, the log monitoring versions should not matter in this case.
Regards,
Babar
- Mark as New
- Subscribe to RSS Feed
- Permalink
06 Dec 2022 10:48 AM
Hi @Babar_Qayyum,
I just checked the xhr "HOST" request - it sends back the 100 with a "totalCount" of 100, which then makes sense that it won't paginate.
I expect something is wrong with the way the service counts the total.
Best regards,
Per
- Mark as New
- Subscribe to RSS Feed
- Permalink
07 Dec 2022 10:53 AM
Hi @perholst !
Thank you for your time to explain details of your situation.
Dynatrace Log Monitoring v1, is a legacy solution and there are no plans to improve this version of Log Monitoring. Upgrade to LMv2 is highly recommended.
The new Log Storage configuration mechanism was introduced in LMv2 (for Managed) and Log Management and Analytics powered by Grail to provide greater flexibility in log source ingest rules configuration and resolve the performance issues that you mention.
New Log Storage rules based on matchers let define log sources for log ingest without the need to inspect every single log source on the given host by defining rules on the environment scope. On the other hand, when the host scope granularity is needed, log storage configuration rules can be defined on the host or host group scope. We're also closely looking at further improvements when it comes to extending the power of log sources matchers.
In favor of migrating to LMv2 I also add new Sensitive Data Masking, Timestamp configuration and Custom log source mechanisms.
If you're interested in learning more, please check the following sources:
- Documentation https://www.dynatrace.com/support/help/how-to-use-dynatrace/log-monitoring/acquire-log-data/log-stor...
- Blog post https://www.dynatrace.com/news/blog/getting-answers-from-data-starts-with-automated-log-acquisition-...
- Feedback channel for new log configurations https://community.dynatrace.com/t5/Feedback-channel/New-Log-storage-configuration-and-Sensitive-data...
Have a nice day!
- Mark as New
- Subscribe to RSS Feed
- Permalink
07 Dec 2022 02:43 PM
Hi @TomekRybczynski,
That is a nice collection of the benefits of Log Monitoring v2, unfortunately that was not quite what I was asking for.
Best regards,
Per


