- Dynatrace Community
- Ask
- Open Q&A
- Export the data from a multi-analysis view to excel
- Subscribe to RSS Feed
- Mark Topic as New
- Mark Topic as Read
- Pin this Topic for Current User
- Printer Friendly Page
- Mark as New
- Subscribe to RSS Feed
- Permalink
15 Nov 2021
08:39 AM
- last edited on
25 Jan 2024
10:30 AM
by
![]() MaciejNeumann
MaciejNeumann
Hi all,
maybe it's a stupid question but, is there an easy way to export the data from a multi-analysis view to excel?
Regards, Josep Maria
Solved! Go to Solution.
- Labels:
-
multidimensional analysis
- Mark as New
- Subscribe to RSS Feed
- Permalink
15 Nov 2021 11:15 AM
Hi @jcamps
No way to export directly data to Excel,
But you can use API to get data in json format (or csv for certain case) and convert to excel if you want.
We are using this method.
Have a good day.
- Mark as New
- Subscribe to RSS Feed
- Permalink
16 Nov 2021 07:19 AM - edited 16 Nov 2021 07:26 AM
Hi @Malaik ,
and with the API how can I get the information from a multi-analysis view? For one fixed service we want the median, percentile 90, avg and sum splitted by all the request names...
do you have some API call example showing how to do this?
With this call:
/api/v2/metrics/query?metricSelector=builtin%3Aservice.response.server%3A%28median%2C%20avg%2C%20percentile%2890%29%2C%20sum%29&resolution=Inf&from=2021-11-11T08%3A00%3A00%2B01%3A00&to=2021-11-11T09%3A00%3A00%2B01%3A00&entitySelector=entityId%28%22SERVICE-6A7A221E0D50BB4F%22%29
we get all the data for a global service but not splitted by request...
Regards! Josep Maria
- Mark as New
- Subscribe to RSS Feed
- Permalink
16 Nov 2021 08:03 AM
A short answer is - you cannot do that in general. MDA has much stronger options and is calculated on the flight from service request data.
Some "simpler" MDA filters such as request count without splitting on the dimension of course match some of the built-in metrics and you can request them.
I really wish there would be an MDA API. There is already an RFE for it.
- Mark as New
- Subscribe to RSS Feed
- Permalink
16 Nov 2021 07:49 AM - edited 16 Nov 2021 07:51 AM
Hi @jcamps
I dont have an exact example
but I think you can use /metrics/query in the API V2
Or for this specific case, I proceed like this.
I create 2 metrics (for avg and sum, but unfortunately not available for median and percentile)
After that I call a API for those metrics.
Or just specify the service in the entity selector with the aggregation...
- Mark as New
- Subscribe to RSS Feed
- Permalink
22 Nov 2021 12:52 PM - edited 22 Nov 2021 12:59 PM
@jcamps I might have a solution to this, but I don't like it myself 😄
Let's assume you have Notepad++ [we will use this knowledge kindly provided by the internet https://stackoverflow.com/questions/45969411/notepad-rows-to-columns-in-groups]
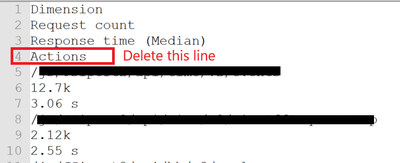
Let's say that you ctrl+C, from the word "Dimensions" on the screen you shared to the bottom of the page:
Let's say that you ctrl+V the copy content in a notepad++ page. Here you manually remove the line where you find "Actions":
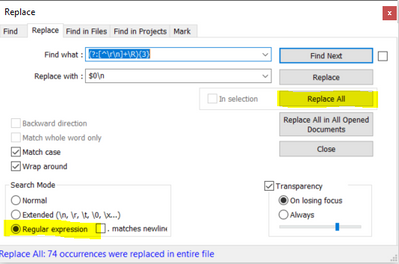
Now, while on notepad++, blindly press ctrl+H (Find and Replace) and insert the following:
- Find what: (?:[^\r\n]+\R){3}
- Replace with: $0\n
and click on "replace all" > this will add a white line after each group of 3 line.
and now proceed again by filling the "find and replace" form with those value:
- Find what: (\R)(?!\R)|(\R\R)
- Replace with: (?1|:\n)
and press on "replace all" > this will separate your data correctly in column divided by |
The end result will look like this:
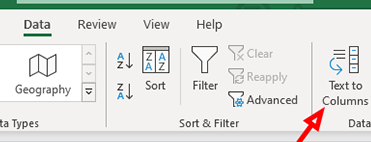
Now your data look good enough to be in an excel sheet (where you can use this function to divide the data into columns); for example:
Wrapping up: this solution is horrible but is also why it kinda make me smile 🙂 it's not the easy way, but it gets the data into our beloved excel.
Regards!
- Mark as New
- Subscribe to RSS Feed
- Permalink
24 Nov 2021 05:59 AM
Th second action didnt make anything for me
- Find what: (\R)(?!\R)|(\R\R)
- Replace with: (?1|:\n)
I will check more.
- Mark as New
- Subscribe to RSS Feed
- Permalink
26 Nov 2021 04:13 PM
Remember to Check the "Regular Expression" field when you are in the Replade window!
Asta la vista
- Mark as New
- Subscribe to RSS Feed
- Permalink
26 Nov 2023 10:47 AM
hi
could you please help me to write the automation for this
we will do all the function in single click
- Mark as New
- Subscribe to RSS Feed
- Permalink
23 Nov 2021 09:46 PM
Hi,
Probably what you need for this scenario is to create a metric with those conditions (https://www.dynatrace.com/support/help/how-to-use-dynatrace/transactions-and-services/service-monito...) and after the metric is created you will be able to char, alert and pull that data.
Regards
- Mark as New
- Subscribe to RSS Feed
- Permalink
24 Nov 2021 07:11 AM
Adding to rodrigo's suggestion,
When you plot the same on to Dashboards, if you have dashboard powerups extension, you can directly export the data to excel.
- Mark as New
- Subscribe to RSS Feed
- Permalink
18 Dec 2021 08:31 PM
Link to the Chrome Extension Dashboard Powerup to export to excel: https://chrome.google.com/webstore/detail/dynatrace-dashboard-power/dmpgdhbpdodhddciokonbahhbpaalmco and github instructions: https://github.com/dynatrace-oss/DynatraceDashboardPowerups#Installation
Happy Holidays!
- Mark as New
- Subscribe to RSS Feed
- Permalink
19 Dec 2021 08:09 AM
Looks like Grafana and Kibana graphical tile 😄 very good job.
Still doesn't cover the multidimensional use case that our beloved community member was asking 🙂
- Mark as New
- Subscribe to RSS Feed
- Permalink
18 Dec 2021 11:32 AM
@tom_rothschaedl fyi
- Mark as New
- Subscribe to RSS Feed
- Permalink
13 Jun 2022 09:04 AM - edited 10 Aug 2022 08:22 PM
Please use the related product idea to vote: https://community.dynatrace.com/t5/Dynatrace-product-ideas/Export-to-CSV-option-throughout-the-UI/id...
EDIT/UPDATE: export to CSV is planned for Multidimensional analysis for services ;).
Featured Posts


