- Dynatrace Community
- Ask
- Open Q&A
- HIERARCHY METRIC
- Subscribe to RSS Feed
- Mark Topic as New
- Mark Topic as Read
- Pin this Topic for Current User
- Printer Friendly Page
- Mark as New
- Subscribe to RSS Feed
- Permalink
12 Sep 2023
11:44 AM
- last edited on
13 Sep 2023
08:31 AM
by
![]() MaciejNeumann
MaciejNeumann
Hello All,
I'm having a problem when trying to create a metric.
Basically what i'm trying to do is create a metric that counts the number of exceptions from a request to a specific service.
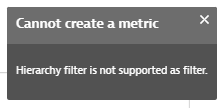
The problem is when i filter i have the message :
Is there any other way to do it ?
Thank you.
Solved! Go to Solution.
- Labels:
-
metrics
-
services classic
- Mark as New
- Subscribe to RSS Feed
- Permalink
13 Sep 2023 03:56 AM
The error message "Hierarchy filter is not supported as filter" indicates that the filtering method you are trying to use in Dynatrace is not supported for creating the metric in the way you are attempting.
To count the number of exceptions from a request to a specific service in Dynatrace, you can use other filtering options or alternative approaches:
1. **Service Filter:**
- Instead of using a hierarchy filter, try using a service filter. You can filter the requests by the specific service you're interested in, and then count the exceptions associated with that service.
2. **Custom Metric:**
- Create a custom metric for exceptions specific to the service. You can use Dynatrace's custom metric capabilities to instrument your code to capture exceptions and increment a counter metric whenever an exception occurs in the context of the service you're interested in.
3. **Alerting Rules:**
- You can create alerting rules in Dynatrace based on exceptions. Define alerting rules to trigger notifications or actions when exceptions exceed a certain threshold for the specific service.
4. **Custom Scripting and API:**
- If the built-in metric creation options do not meet your requirements, you can also consider using custom scripting and Dynatrace's API to extract and count exceptions from the service in a more customized way.
5. **Dynatrace Support:**
- If you're still facing difficulties or if your use case is complex, consider reaching out to Dynatrace support for specific guidance on how to achieve your metric counting goals.
The exact approach you choose will depend on your specific use case and requirements. If you can provide more details about your setup and requirements, I can offer more specific guidance on which approach might be most suitable for your situation.
- Mark as New
- Subscribe to RSS Feed
- Permalink
13 Sep 2023 08:52 AM
@natanael_mendes thanks for the effort.
Here is what i'm trying to do exactly :
- I have a service (Proxy)
- proxy is calling a lot of other services with the same request (let's call it proxy/request)
When using exception count metric i can see all the exceptions generated on the proxy level.
what i need is to see the exception that are generated only when calling a specific service (let's call it service X)
i can do that using MDA using the filter "Called service"
but now i need to display that on a Dashboard and i can't find a way because i can't create the metric with that filter.
basically the filter is : any exception + on request (proxy/request) + called service (Service X)
I hope this is clear
- Mark as New
- Subscribe to RSS Feed
- Permalink
13 Sep 2023 09:33 AM
Hi @SOBE
I'll check back later to see if it's possible to pull what you need for the dashboard on my demo environment (unless someone writes back in the meantime). Alternatively, you can try to use Markdown Tile and make there a hyperlink to Multidimentional (without creating a metric) - yes I know it's a workaround, but I sometimes use it with clients.
Radek
- Mark as New
- Subscribe to RSS Feed
- Permalink
13 Sep 2023 09:35 AM
@radek_jasinski yes the markdown tile is my last solution if i can't find anything.
Thanks for the effort and i hope to hear from you soon !
- Mark as New
- Subscribe to RSS Feed
- Permalink
13 Sep 2023 12:08 PM
Unfortunately, in my opinion, you are left with Markdown.
DT doesn't allow you to configure metrics that way.
- Mark as New
- Subscribe to RSS Feed
- Permalink
13 Sep 2023 12:00 PM
Yes but they said they'll only add this to grail and i'm a Managed user so i have to find some kind of workaround...
Featured Posts

