- Dynatrace Community
- Dynatrace
- Ask
- Open Q&A
- Re: Houston we have a problem ... we loose OneAgent traffic
- Subscribe to RSS Feed
- Mark Topic as New
- Mark Topic as Read
- Pin this Topic for Current User
- Printer Friendly Page
Houston we have a problem ... we loose OneAgent traffic
- Mark as New
- Subscribe to RSS Feed
- Permalink
17 Apr 2020 12:51 AM
Dear
i finish all idea's
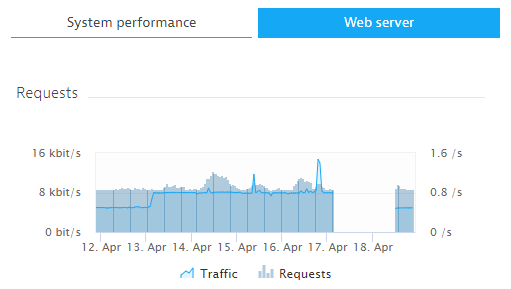
i've same strange case where traffic is dropped from same host (not all, and sometimes in different hours) for some hours and after reappear. (Unix host - Http.d process group).
Seem that in same condition, OneAgent stop collecting data. For sure is not HU limit issue but seem injection is loosed under not know (to me) condition. checking process group seem to be random and effecting not all host serving the same application ..
Do you experience something similar ?
Thank you in advance. Any suggestion is appreciated
M
- Mark as New
- Subscribe to RSS Feed
- Permalink
17 Apr 2020 07:24 AM
Hi @Domenico B.
I would start with looking into the OA logs under the os directory.
Yos
- Mark as New
- Subscribe to RSS Feed
- Permalink
17 Apr 2020 09:14 PM
Hi @Yos N.
thank you for reply.I'm not so expert about this logs. Do you have any suggestion ? What i have to looking for ?
Thank You Domenico
- Mark as New
- Subscribe to RSS Feed
- Permalink
18 Apr 2020
10:16 AM
- last edited on
27 Mar 2023
10:45 AM
by
![]() MaciejNeumann
MaciejNeumann
Hi @Domenico B.,
Look for error messages around the time of the loss of data.
Pay attention that the log time are on UTC time.
But I think a faster way will be to be in touch with dynatrace one thru the in-product-chat or directly open a ticket at support
HTH
Yos
- Mark as New
- Subscribe to RSS Feed
- Permalink
18 Apr 2020 08:43 PM
Hi @Yos N.
thank you. I opened a ticket as suggested but i want to deep and learn more to be more expert an autonomous in managing my installation. There are a lot of log files to be checked and is not so easy if i do not know what i'm looking for
M.
- Mark as New
- Subscribe to RSS Feed
- Permalink
19 Apr 2020 08:43 AM
Yep lots of information in the logs... usually hovering the errors and info around the time of problem helps to find the issue.
And if you get lost there ask help from support as John Belushi said "when the going gets tough, the tough get going."
Yos
- Mark as New
- Subscribe to RSS Feed
- Permalink
17 Apr 2020 09:06 AM
Is it Managed or SaaS? ALR?
- Mark as New
- Subscribe to RSS Feed
- Permalink
17 Apr 2020 11:36 PM
Can you clarify what you mean by "loose traffic"? A screenshot? Can you include a screenshot of the host memory (or CPU) metric during the timeframe when you were loosing traffic?
- Mark as New
- Subscribe to RSS Feed
- Permalink
18 Apr 2020 08:58 PM
i mean .. no more data. We restart Services today and start working again. But i need to understand root cause.

- Mark as New
- Subscribe to RSS Feed
- Permalink
19 Apr 2020 04:46 PM
I was hoping to get a screenshot of the host memory (or CPU) metric during this period. This would be important to determine if just monitored technology data was lost, or if infrastructure data was also lost. TIA.
- Mark as New
- Subscribe to RSS Feed
- Permalink
19 Apr 2020 10:41 PM
no other metric are available like in infra mode only. But i'm in full stack mode. This is strange.
- Mark as New
- Subscribe to RSS Feed
- Permalink
18 Apr 2020 11:22 AM
Hi Domenico,
Just posted a similar question, looks the same or completely different?
KR Henk
- Mark as New
- Subscribe to RSS Feed
- Permalink
18 Apr 2020 09:14 PM
Hi @Henk S.
i check your question and i answer to you. In my case i take error 404 from JavaScript in All pages. In your case seem to some something i see in the past. let's try and let's me know 🙂
M.
