- Dynatrace Community
- Ask
- Open Q&A
- Re: How can I vizualize the host consumption per host?
- Subscribe to RSS Feed
- Mark Topic as New
- Mark Topic as Read
- Pin this Topic for Current User
- Printer Friendly Page
- Mark as New
- Subscribe to RSS Feed
- Permalink
11 May 2023
07:07 PM
- last edited on
12 May 2023
09:54 AM
by
![]() MaciejNeumann
MaciejNeumann
Hi everyone,
I would like to know where I can visualize how many host units each host consumes. In the previous account management design I had that option and I could export that data, but with the new design I can't find that section.
Thanks in advance
Solved! Go to Solution.
- Labels:
-
hosts classic
-
licensing
- Mark as New
- Subscribe to RSS Feed
- Permalink
11 May 2023 07:52 PM
I use this formula in Data Explorer to show the amount of HU by host by hour:
(builtin:billing.ddu.includedMetricPerHost:splitBy("dt.entity.host"):avg:auto:sort(value(avg,descending)):limit(100))/(1000)
Try and let us know.
- Mark as New
- Subscribe to RSS Feed
- Permalink
11 May 2023 08:26 PM
Hi @dannemca
Thank you for your response. This formula will be very helpful. I just need to adjust it to show me the exact amount of host unit per host.
- Mark as New
- Subscribe to RSS Feed
- Permalink
11 May 2023 08:59 PM
If you set your timeframe to last 1h, you will see the exactly amount of HU by host. At least the ones with fullstack.
- Mark as New
- Subscribe to RSS Feed
- Permalink
29 May 2023 10:22 PM
Can you please explain how this formula produces the HU per host?
- Mark as New
- Subscribe to RSS Feed
- Permalink
30 May 2023 02:17 PM
I don't know exactly, I just got the formula from the demo.live.dynatrace.com dashboard list and tested on my own env, and the numbers just matched.
- Mark as New
- Subscribe to RSS Feed
- Permalink
31 May 2023 01:40 PM
Yeah, me too. It seems strange. It is a DDU metric and after a few divisions it concludes to the HU consumption. DT magic! 😛
- Mark as New
- Subscribe to RSS Feed
- Permalink
20 Jan 2025 11:37 AM
In case anybody else in wondering the same thing, you get 1000 included metrics per host unit (see https://docs.dynatrace.com/docs/manage/monitoring-consumption-classic/davis-data-units/metric-cost-c...). So if you divide the number of included metrics by 1000, you get the number of host units
- Mark as New
- Subscribe to RSS Feed
- Permalink
15 May 2023 11:07 AM
My team and I took the original formula and we edited it a bit to get the consumption for Full stack and for Infra only as well
Fullstack: (builtin:billing.ddu.includedMetricPerHost:filter(and(or(in("dt.entity.host",entitySelector("type(host),monitoringMode(~"FULL_STACK~")"))))):splitBy("dt.entity.host"):avg:auto:sort(value(avg,descending)):limit(200))/(1000)/(61)
Infra only: (builtin:billing.ddu.includedMetricPerHost:filter(and(or(in("dt.entity.host",entitySelector("type(host),monitoringMode(~"CLOUD_INFRA~")"))))):splitBy("dt.entity.host"):avg:auto:sort(value(avg,descending)):limit(100))/(1000)/(80)
- Mark as New
- Subscribe to RSS Feed
- Permalink
16 Dec 2024 04:58 PM - edited 16 Dec 2024 05:30 PM
Hello @Ahmed_Khaled
Thank you so much for the formula! You're a saver! The formulas you posted worked like a charm for me!
I am not yet experienced with composing these formulas and now I am struggling to get a single value from them.
Basically using your formulas, I was able to get the HU consumption per host for each management zone. Now I want to add another tile that shows me the HU consumption as one number for the whole management zone. I know I should add some aggregation to your formula, but I am not sure how to do so. Can you help me with that?
- Mark as New
- Subscribe to RSS Feed
- Permalink
15 May 2023 11:20 AM
The simplest way get info via API and parse into CSV
maybe with new dashboard we can do it inside dyna, since external call possible to attach...
"""https://www.dynatrace.com/support/help/dynatrace-api/environment-api/oneagent-on-host"""
"""https://www.dynatrace.com/news/blog/improved-supportability-of-dynatrace-oneagent/"""
- Mark as New
- Subscribe to RSS Feed
- Permalink
15 May 2023 11:38 AM - edited 15 May 2023 11:39 AM
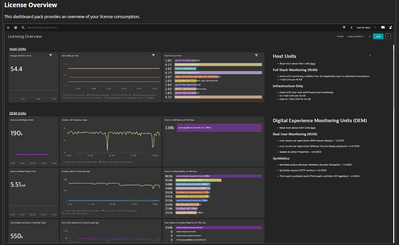
Licensing dashboard at BizOps, which also gives other metrics like DEM and DDUs
https://dynatrace.github.io/BizOpsConfigurator/#deploy/all/Licensing%20Overview
- Mark as New
- Subscribe to RSS Feed
- Permalink
15 May 2023 11:48 AM
Yeah, this is great - just imported
https://github.com/TechShady/Dynatrace-Dashboards/blob/master/Licensing%20Overview.json
all works OOB
- Mark as New
- Subscribe to RSS Feed
- Permalink
31 May 2023 02:28 PM - edited 31 May 2023 02:29 PM
Dynatrace runs a script that populates the billing hostunit ddu metric every 15 minutes. And only gives a grand total.. I am no expert in Dataexplorer and not a big fan of manually entered entitySelector based queries, since they are not selectable in the dropdown list and all manually entered text is prone to errors.
So I decided to run a scheduled script to query the api and fetch the hostunit count for all hosts and I store the HostUnit count as a custom metric 'HostUnits' on those hosts 😬
We now have a nice way to slice and dice HU consumption from the Data Explorer ui. I can Split on hosts, filter on tags, management zones, hostgroups and some history..
This is a workaround of course.
It would be so nice if HU consumption was just made available as queryable host metadata, metric or property readily available in data explorer dropdown UI.
Featured Posts

