- Dynatrace Community
- Dynatrace
- Ask
- Open Q&A
- How to count requests to HTTP and HTTPS?
- Subscribe to RSS Feed
- Mark Topic as New
- Mark Topic as Read
- Pin this Topic for Current User
- Printer Friendly Page
How to count requests to HTTP and HTTPS?
- Mark as New
- Subscribe to RSS Feed
- Permalink
29 Jul 2021 04:19 PM
When I was asked to give the number of requests in an app pool with requests to port 80 & 443, I thought it would be a breeze...
I haven't managed to find a way how to count this at the service level, not even with Request Attributes? Anyone got an idea?
- Labels:
-
services
- Mark as New
- Subscribe to RSS Feed
- Permalink
29 Jul 2021 04:36 PM
Hi Antonio,
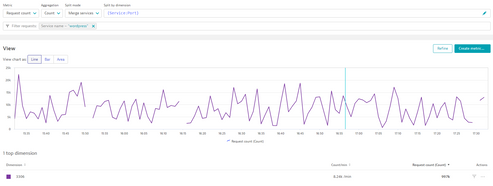
That should be feasible with Multidimensional analysis. Go to Diagnostic Tools on the side menu, then Create analysis view, and use "Service:Port" as the dimension to split by, Request count as the metric, and add filters to the request filter field until you see the service that you want. From there, you can create a custom metric if you want to display that on a dashboard, for instance. You can also save that view for future reference or to share it with other people with access to the environment.
Regards,
Álvaro
- Mark as New
- Subscribe to RSS Feed
- Permalink
29 Jul 2021 04:37 PM
See this image for reference, if something like this is what you're looking for.
- Mark as New
- Subscribe to RSS Feed
- Permalink
29 Jul 2021 06:20 PM
Interesting suggestion! But when I went to check it out, it seems that the ports that appear are the ones related to other services that are being invoked, and not the ports that the service is listening on.
- Mark as New
- Subscribe to RSS Feed
- Permalink
29 Jul 2021 04:38 PM - edited 29 Jul 2021 04:38 PM
May be split MDA by {URL:Host} can help you for this?
HTH
Yos
- Mark as New
- Subscribe to RSS Feed
- Permalink
29 Jul 2021 06:23 PM
Thanks for the suggestion. My problem is that it's an application pool that listens on both 80 & 443, and Dynatrace aggregates them by the typical <serviceName>:80,443, using {URL:Host} doesn't give me the distribution for the two ports.
Even only by the
- Mark as New
- Subscribe to RSS Feed
- Permalink
29 Jul 2021 06:24 PM
BTW, the idea behind this question is trying to figure out how many users are still accessing HTTP port 80. Of course there are lots of security concerns using port 80, and I'm trying to demonstrate that the number of requests should be very low... But I can't get it. I was expecting that something so simple wouldn't require an RFE...
- Mark as New
- Subscribe to RSS Feed
- Permalink
30 Jul 2021 06:25 AM
Hi @AntonioSousa any chance there is use of Schema or Accept-Schema http headers in this service that you can set RA on? Anyway for getting the answer to your question IMO you can ask the FW guys to split the requests by protocol and send http requests to url:80 and the https requests to url:433 so you will get 2 separated services in dynatrace.
HTH Yos
- Mark as New
- Subscribe to RSS Feed
- Permalink
30 Jul 2021 09:40 AM
Thanks for the suggestion. It's a little overkill for what I need, but your sugestion is interesting, because I can ask the question about the distribution directly to them 🙂
In any case, it seems like a case for an RFE...
- Mark as New
- Subscribe to RSS Feed
- Permalink
30 Jul 2021 09:51 AM
The RFE is at:


