This website uses Cookies. Click Accept to agree to our website's cookie use as described in our Privacy Policy. Click Preferences to customize your cookie settings.
Open Q&A
If there's no good subforum for your question - ask it here!
Turn on suggestions
Auto-suggest helps you quickly narrow down your search results by suggesting possible matches as you type.
- Community Home
- Platform
- Open Q&A
- How to create a personalized group of process to see the resources consumption in detail?
Options
- Subscribe to RSS Feed
- Mark Topic as New
- Mark Topic as Read
- Pin this Topic for Current User
- Printer Friendly Page
Options
- Mark as New
- Subscribe to RSS Feed
- Permalink
03 Feb 2020 01:05 PM
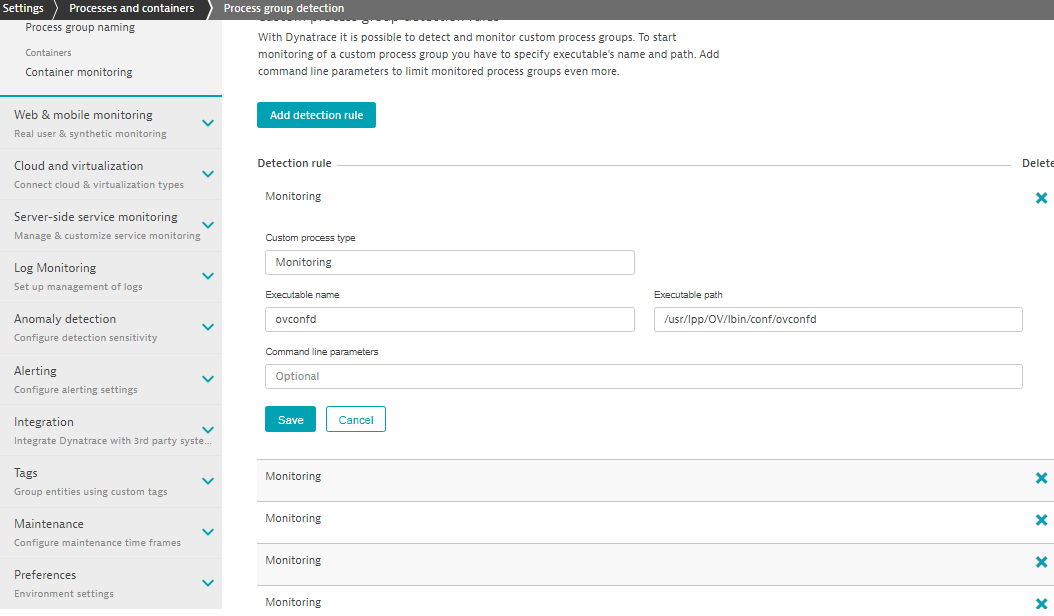
Hi, I followed all the steps in https://www.dynatrace.com/news/blog/set-custom-process-groups-monitoring/ to create a custom process group, but it didn't work.
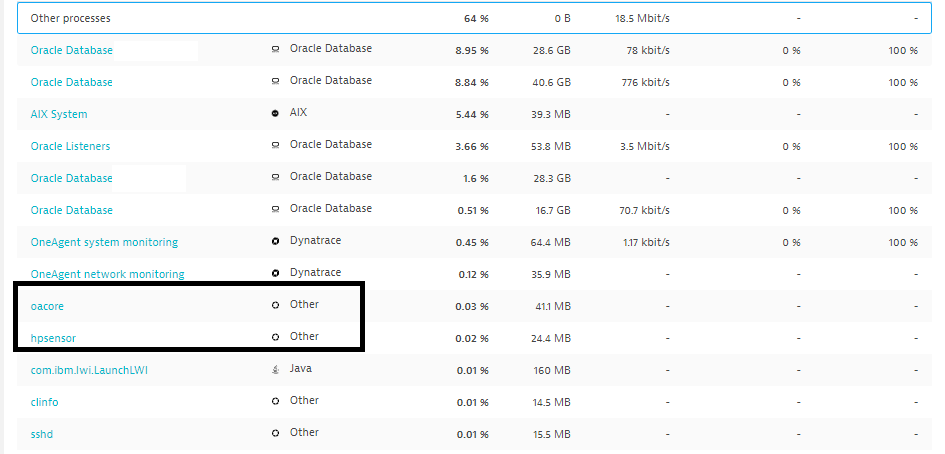
Actually, my environment has been gotten problems with CPU consumptions and more than 60% of this resourse usage is taken by "other" process that Dynatrace doesn't sort automatically. So I created the custom groups, but all the process that I set (like monitoring, backup, etc) is still labeled as "other process".
Solved! Go to Solution.
Labels:
- Labels:
-
process groups
4 REPLIES 4
Options
- Mark as New
- Subscribe to RSS Feed
- Permalink
05 Feb 2020 05:53 PM
Did you make restart of those processes after process group definition?
Sebastian
Regards, Sebastian
Options
- Mark as New
- Subscribe to RSS Feed
- Permalink
07 Feb 2020 10:39 AM
Hi Sebastian. Thanks for the answer. Now, I restarted both oneagent and some of the personalized process, but all of them is still shown as other process. What a think too strange is the low level of cpu usage by oracle reported and the high cpu usage by these "other process"".When I see the resources consumption locally in the OS, I got a higher usage for Oracle, specially for the clients and web/application server connections that aren't local.
Options
- Mark as New
- Subscribe to RSS Feed
- Permalink
07 Feb 2020 11:48 AM
Rise support ticket than. This has to have some explanation
Regards, Sebastian
Options
- Mark as New
- Subscribe to RSS Feed
- Permalink
27 Feb 2020 07:41 PM
This just means the consumption is still by a process that is not being directly known.
For CPU or RAM usage Dynatrace shows just known processes and everything else is "Other processes". Including kernel processes.
Dynatrace Ambassador | Alanata a.s., Slovakia, Dynatrace Master Partner
Featured Posts
