- Dynatrace Community
- Ask
- Open Q&A
- How to monitor Azure Container Apps with Dynatrace?
- Subscribe to RSS Feed
- Mark Topic as New
- Mark Topic as Read
- Pin this Topic for Current User
- Printer Friendly Page
- Mark as New
- Subscribe to RSS Feed
- Permalink
12 Apr 2023
07:55 PM
- last edited on
12 Apr 2023
08:06 PM
by
![]() Karolina_Linda
Karolina_Linda
Azure Container Apps is a relatively new fully managed serverless container service in Azure.
How can it be monitored with Dynatrace?
Solved! Go to Solution.
- Labels:
-
azure
- Mark as New
- Subscribe to RSS Feed
- Permalink
13 Apr 2023
09:57 AM
- last edited on
05 Aug 2023
03:44 PM
by
![]() andre_vdveen
andre_vdveen
Hi @shawnz88
Azure Container Apps is part of Container Services.
To monitor basic metrics, you can use, for example, https://www.dynatrace.com/support/help/shortlink/azure-container-instances
It's worth verifying that you can install OA on the container as you can with AKS 🙂
Regards,
Radek
- Mark as New
- Subscribe to RSS Feed
- Permalink
18 Apr 2023 01:03 AM
@shawnz88 I have been keeping my eye on this topic for a while.
You can bake the oneagent into your dockerBuild file to get service level insights and the rest of the OA feature set
As for monitoring the ACA infrastructure/runtime this has been asked of from both Microsoft and Dynatrace. Currently the Azure set of Dynatrace, last I checked, didn't have the option to pull in the MS telemetry for the underlying ACA-Env/containers. I am also not sure how it will deal with logging as the default is to ship them to a Log analytics workspace.
- Mark as New
- Subscribe to RSS Feed
- Permalink
18 Apr 2023 01:25 PM
You can monitor it by installing the OA inside of the container (dockerfile), but there are some limitations / challenges.
- You can't Customize OneAgent installation (ex host groups, custom properties, custom hostnames, etc)
- agent tools (ex oneagentctl) are not included in the installation => you won't be able to use them.
- Making customisation in the Dynatrace UI after deployment is only a temporary solution => containers are immutable so everytime you make a change it will create a completely new container and this container will be detected as a new host in dynatrace.
- Only global dynatrace settings will apply to your container hosts => all other changes you will lose when the container is killed and a new one created, because it is a completely new host.
- Because Dynatrace creates a new host for each individual container, it becomes more difficult to keep track of everything neatly. Containers are relatively short living especially if you have automatic up-downscaling.
Monaco could be a possible solution to keep your config, but I still need to test this.
An other possible solution is executing a custom script in you pipeline after container deployment to set settings (using dynatrace API) .
- Mark as New
- Subscribe to RSS Feed
- Permalink
05 Mar 2024 11:47 AM
@dylan_taelemansDo we have a solution to have a consistent host name whenever the container restarts? I am seeing multiple hosts added in the Dynatrace hosts section whenever the container restarts.
- Mark as New
- Subscribe to RSS Feed
- Permalink
06 Mar 2024 05:47 AM - edited 06 Mar 2024 05:48 AM
@shibily, a container is immutable so restart will generate an entirely new 'host/container'. Therefore, Dynatrace will also recognize this as a new host. For host naming, we've established a Global rule using the AzureHostName property, which incorporates the slot name {Host:AzureHostName/^([^.]++)}. Additionally, we used condition Paas Type equals 'Azure Websites.' You can experiment with adding IP, but keep in mind that it will result in longer names.
For dashboarding purposes, we can harness the creative capabilities of Grail to generate visually appealing graphs with minimal interruptions and color changes when splitting on hosts. However, they can still be a bit challenging from time to time. 😄
- Mark as New
- Subscribe to RSS Feed
- Permalink
06 Mar 2024 04:39 AM - edited 06 Mar 2024 04:40 AM
@shibily I think it depends on what you intend to do. The host names will be different due to revision/replica combinations.
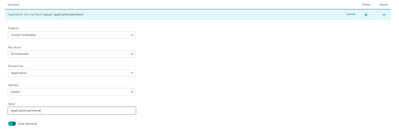
I have tested using and environment variable applied to the container:

Then you can use a host name rule to remove the bits at the end. like below but you will require one rule per application name if there are many. The gui doesnt allow regex but the api might?

I haven't had much time to play with how this will look in the data explorer. i.e are all the host measured on one line with no instance(revision/replica) splitting?
Again I think it depends on what you are trying to do. I think each revision and replica SHOULD be a separate host but we also need a way to measure deviations across revisions and replica for threshold alerting and dashboarding.
I'm just going to leave the tag on for my ones and not bother with renaming the individual hosts/services as i want to know exactly which node is playing up.
I would be nice if the detected metadata could be expanded to behave like a process group/container group.
- Mark as New
- Subscribe to RSS Feed
- Permalink
24 Jun 2025 04:43 PM
Are above still the best option to Azure Container Apps with Dynatrace?
- Mark as New
- Subscribe to RSS Feed
- Permalink
24 Jun 2025 07:26 PM - edited 24 Jun 2025 07:32 PM
Yes,
As far as I know you still have the same two options:
- Monitor limited basic metrics via the Azure integration:
https://www.dynatrace.com/support/help/shortlink/azure-container-instances
OR
Bake the Dynatrace OneAgent into your Dockerfile:
https://docs.dynatrace.com/docs/ingest-from/setup-on-container-platforms/docker/set-up-oneagent-on-c...
- Mark as New
- Subscribe to RSS Feed
- Permalink
25 Jun 2025 08:32 AM
Yes, it’s the best option at the moment.
Featured Posts
