This website uses Cookies. Click Accept to agree to our website's cookie use as described in our Privacy Policy. Click Preferences to customize your cookie settings.
Open Q&A
If there's no good subforum for your question - ask it here!
Turn on suggestions
Auto-suggest helps you quickly narrow down your search results by suggesting possible matches as you type.
- Community Home
- Platform
- Open Q&A
- Re: Is there a way to capture the total trace count displayed in a Distributed traces graph
Options
- Subscribe to RSS Feed
- Mark Topic as New
- Mark Topic as Read
- Pin this Topic for Current User
- Printer Friendly Page
Options
- Mark as New
- Subscribe to RSS Feed
- Permalink
08 Jan 2025 02:06 PM
Hello:
There are times where it would be nice to be able to say
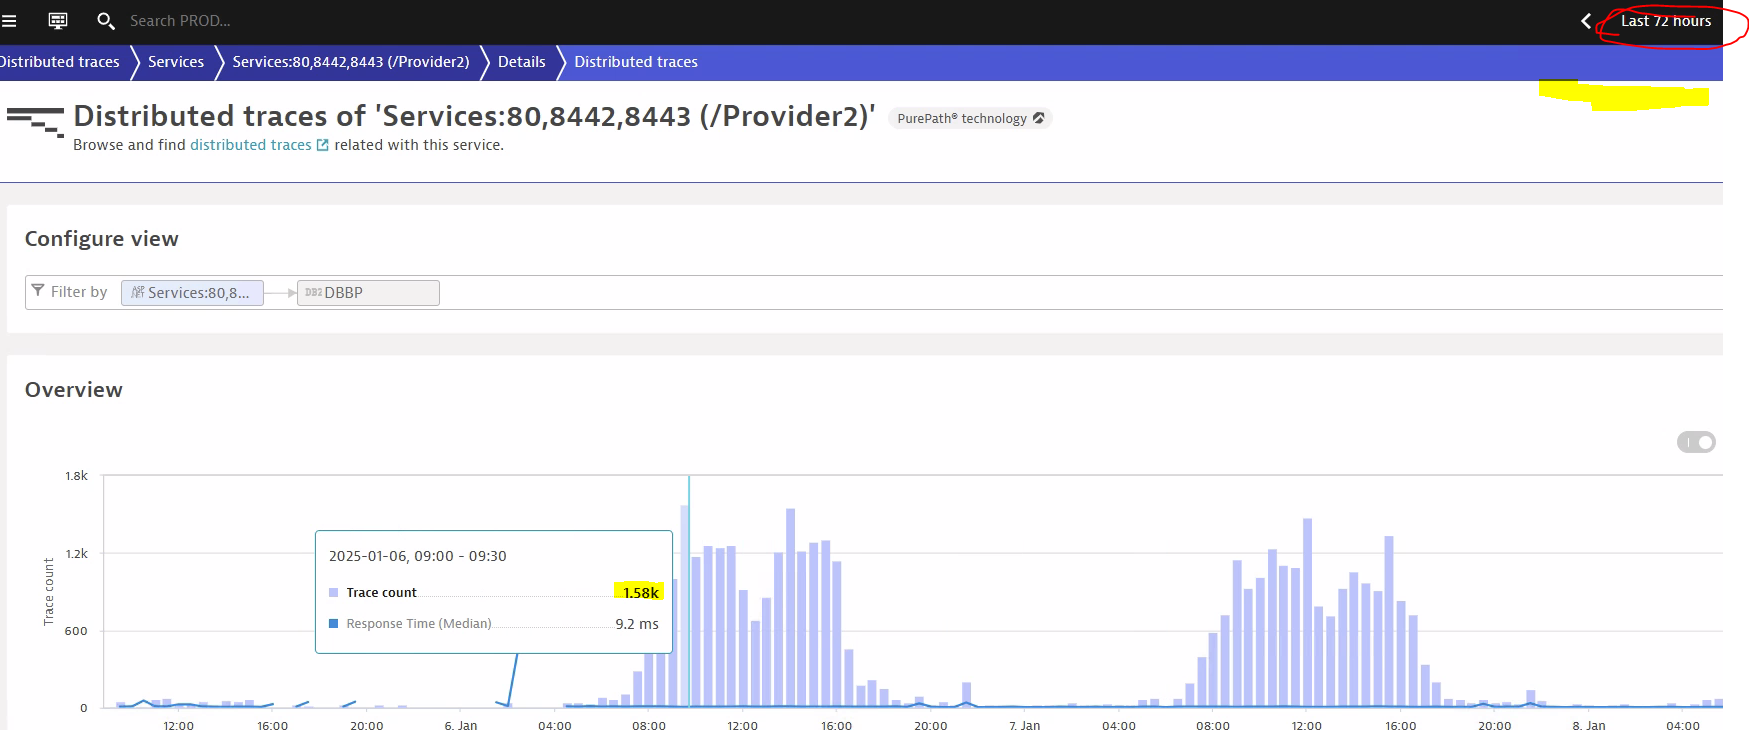
"We saw X number of traces" between service A and service B within a specified period of time.
We can see the bar graphs show the breakdown per "sub interval " of time (e.g. 1.58K traces)
But is there a way to SUM or total the number of traces seen in that overall time period?
Solved! Go to Solution.
Labels:
- Labels:
-
distributed tracing
-
metrics
Capture.PNG
226 KB
1 REPLY 1
Options
- Mark as New
- Subscribe to RSS Feed
- Permalink
08 Jan 2025 05:04 PM
Hi runatyr!
I think that a solution for you need could be using the Multidimensional Analysis.
In the Service A Page, filtering for the "called service" B (as you also shown in your image) you can go to Throughput tab and then click on Create Analysis View button

You can check your data scrolling to the end of the opened page

Unfortunately there is no way you could export this data into a custom metric so you can't insert this data on a Dashboard tile 🙁

I hope that this will help you 😊
Best regards,
Davide
Reply
Featured Posts
