This website uses Cookies. Click Accept to agree to our website's cookie use as described in our Privacy Policy. Click Preferences to customize your cookie settings.
Open Q&A
If there's no good subforum for your question - ask it here!
Turn on suggestions
Auto-suggest helps you quickly narrow down your search results by suggesting possible matches as you type.
- Community Home
- Platform
- Open Q&A
- JVM metrics in a single chart for several processes
Options
- Subscribe to RSS Feed
- Mark Topic as New
- Mark Topic as Read
- Pin this Topic for Current User
- Printer Friendly Page
Options
- Mark as New
- Subscribe to RSS Feed
- Permalink
10 Jul 2020 09:50 AM
Hi all,
we've several java processes in my system and I want to review some JVM parameters for all of these processes.
I can see all those metrics in the "Process metrics -> Java managed" metrics section but only process by process not in a single char splitted by process.
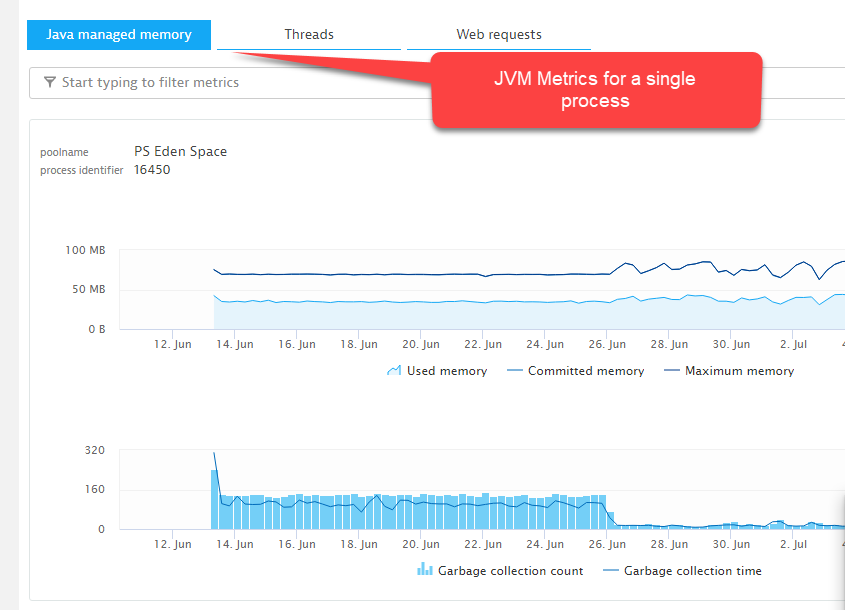
So, how can I view these metrics in a single chart split by process instance?
Thanks in advance!
Solved! Go to Solution.
Labels:
- Labels:
-
java
4 REPLIES 4
Options
- Mark as New
- Subscribe to RSS Feed
- Permalink
10 Jul 2020 11:33 AM
Hi @Jose C.
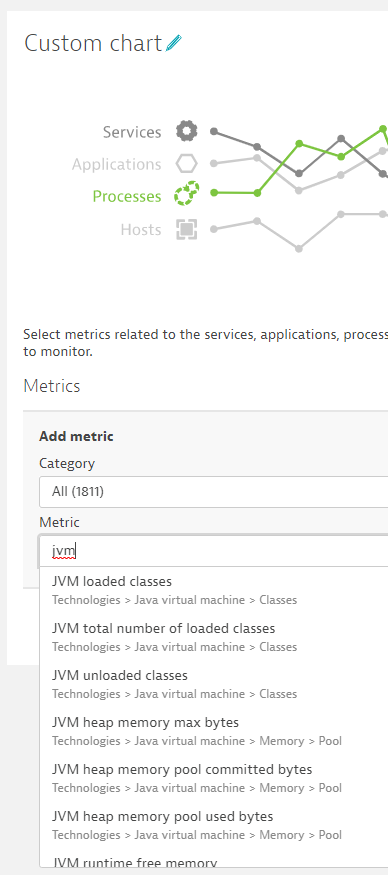
Please check the JVM metrics under custom charts
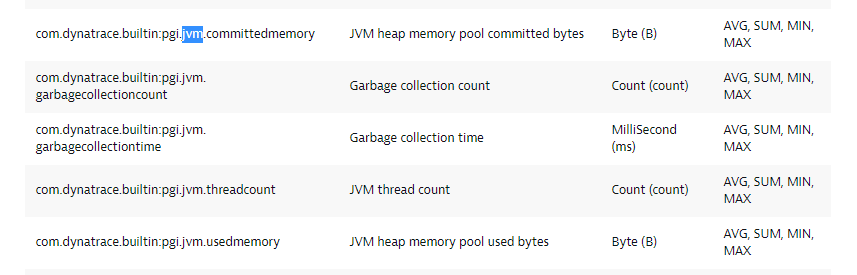
And for JVM metrics under infrastructure information of Timeseries v1 Available metrics
HTH
Yos
dynatrace certificated professional - dynatrace master partner - Matrix Soft Ware Division - Israel
Reply
Options
- Mark as New
- Subscribe to RSS Feed
- Permalink
10 Jul 2020 01:21 PM
Great answer Yos!
Only thing I would add is to look into using the Metrics API instead of Timeseries. Timeseries will eventually be deprecated and the Metrics API is much more powerful.
https://www.dynatrace.com/support/help/dynatrace-api/environment-api/metric-v2/
Thanks,
Ari
Reply
Options
- Mark as New
- Subscribe to RSS Feed
- Permalink
10 Jul 2020 01:41 PM
Hi @Yos N.,
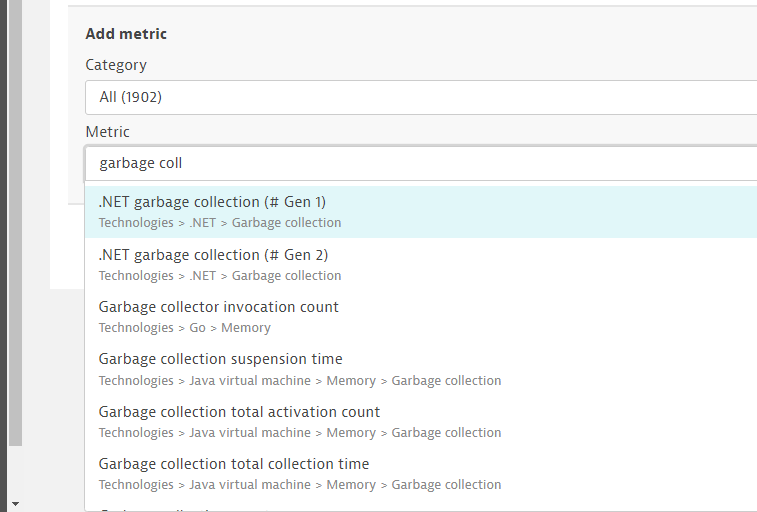
thanks for your response, I'm interested in GC Collection count and GC Collection time but I want to view in a chart.
Regards, Josep Maria
Options
- Mark as New
- Subscribe to RSS Feed
- Permalink
10 Jul 2020 01:44 PM
You can use custom charts for that as well similar to Yos' screenshot.
Thanks,
Ari
Featured Posts
