- Dynatrace Community
- Ask
- Open Q&A
- Re: Make a time series graph of traffic between hosts where Oneagent is installed
- Subscribe to RSS Feed
- Mark Topic as New
- Mark Topic as Read
- Pin this Topic for Current User
- Printer Friendly Page
- Mark as New
- Subscribe to RSS Feed
- Permalink
31 Mar 2023
06:39 AM
- last edited on
31 Mar 2023
08:48 AM
by
![]() Ana_Kuzmenchuk
Ana_Kuzmenchuk
Hi
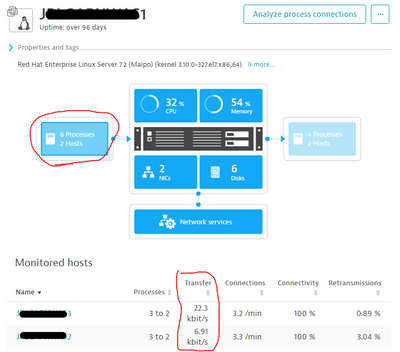
I would like to visualize traffic between hosts with OneAgent installed. As shown in the screenshot, traffic between hosts is displayed as "Transfer". Is it possible to display this value as time series data in a graph with Data Explorer? I tried looking up the metrics, but I couldn't find any relevant metrics.
Toshimasa Shirai.
Solved! Go to Solution.
- Labels:
-
data explorer
-
metrics
-
network monitoring
- Mark as New
- Subscribe to RSS Feed
- Permalink
31 Mar 2023 07:47 AM
Hi,
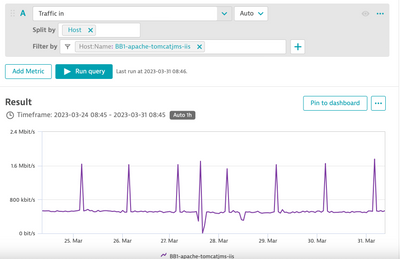
You can use this metrics with splitting by host:
- Traffic in
- Traffic out
Radek
- Mark as New
- Subscribe to RSS Feed
- Permalink
31 Mar 2023 08:47 AM
I think there is a problem with my question and I confused you. sorry.
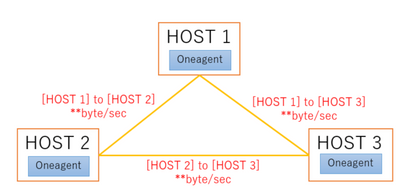
What I want to investigate is that there are three hosts "1", "2", and "3" with Oneagent installed, and traffic is generated from each host to host. As shown in the figure below, I would like to visualize the traffic on a host-to-host basis and create a time series graph.

Toshimasa Shirai.
- Mark as New
- Subscribe to RSS Feed
- Permalink
31 Mar 2023 09:28 AM
Hi,
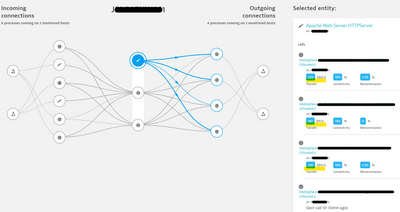
You have Analyze process connections but this is for processes instead of hosts, just in case.
Best regards
- Mark as New
- Subscribe to RSS Feed
- Permalink
31 Mar 2023 10:41 AM
Hi Anton-san.
Thanks for your comment.
"Analyze process connections" is also interesting. You can also see Process to Process traffic as seen in this screenshot. I would like to be able to express Process to Process traffic in a time series graph as well.
- Mark as New
- Subscribe to RSS Feed
- Permalink
31 Mar 2023 10:55 AM
Hi @Shirai and @AntonPineiro
I don't know if we can fully meet your expectation at Dynatrace. What I would do is, export these metrics outside of Dynatrace. Then based on them I would build the appropriate visualizations in Kibana or Grafana for example. Alternatively, I would write a piece of code to show me these dependencies based on the metrics from DT.
Radek
- Mark as New
- Subscribe to RSS Feed
- Permalink
05 Dec 2023 09:46 AM
I think Dynatrace should be able to do this. If this isn't a Product Idea it should be turned into one.
The above examples of Classic Host page and Process connections, they are great, but are based on the "now", real time. So going back to a previous situation, like last week monday 10AM, will not work. (Not even an option with Process connections, Host classic does not update/reflect the timebox) (Also on process level, the historical metric info isn't available)
There are plenty of cases that there was a lot of traffic at some point, where it would be very helpful, if you could split this out to connected hosts sending or receiving that traffic on a certain point of time in the past (e.g. was is the database server, a web server, or some host not monitored?). If this added dimention could mean a lot of extra data, maybe it could be turned into a switch.
See also Solved: Finding source of abnormal (high/low) traffic - Dynatrace Community
Provide Traffic volume metric for Database direction - Dynatrace Community
Featured Posts


