- Dynatrace Community
- Ask
- Open Q&A
- Monitor batch jobs that reoccur > 60 minutes
- Subscribe to RSS Feed
- Mark Topic as New
- Mark Topic as Read
- Pin this Topic for Current User
- Printer Friendly Page
- Mark as New
- Subscribe to RSS Feed
- Permalink
29 Nov 2021
07:46 AM
- last edited on
29 Nov 2021
10:17 AM
by
![]() MaciejNeumann
MaciejNeumann
Any thoughts on monitoring a batch job that runs say every 6 hours, 24 hours, or 168 hours? The custom event for alerting feature allows only for a max of 60 minute (rolling window).
We have two options to report status.
1) we build into our batch job a Metrics v2 API call that stores a status-as-a-metric every time the batch job runs.
2) we monitor a log file for the status value.
Issue: in both cases if a catastrophic failure occurs no status will be reported.
The alert needs to trigger if the metric stops reporting for 6, 12, 168 hours. Or, within the same window 6, 12, 168 hours a metric value of 0 (or less than 1) is reported.
I have no way of obtaining a heartbeat or status between executions.
thoughts?
Solved! Go to Solution.
- Labels:
-
problem detection
-
timeframe
- Mark as New
- Subscribe to RSS Feed
- Permalink
29 Nov 2021 10:09 AM
Hi,
I've been trying to solve these kind of usecases for a very long time (with AppMon and Dynatrace). A very common case for example are periodic CronJobs on the Hybric commerce platform.
In the end I found a working solution but that involves quite some "external" logic, but the general process for me is the following:
- find a way that reports the status of the job execution, the job start, the job end.
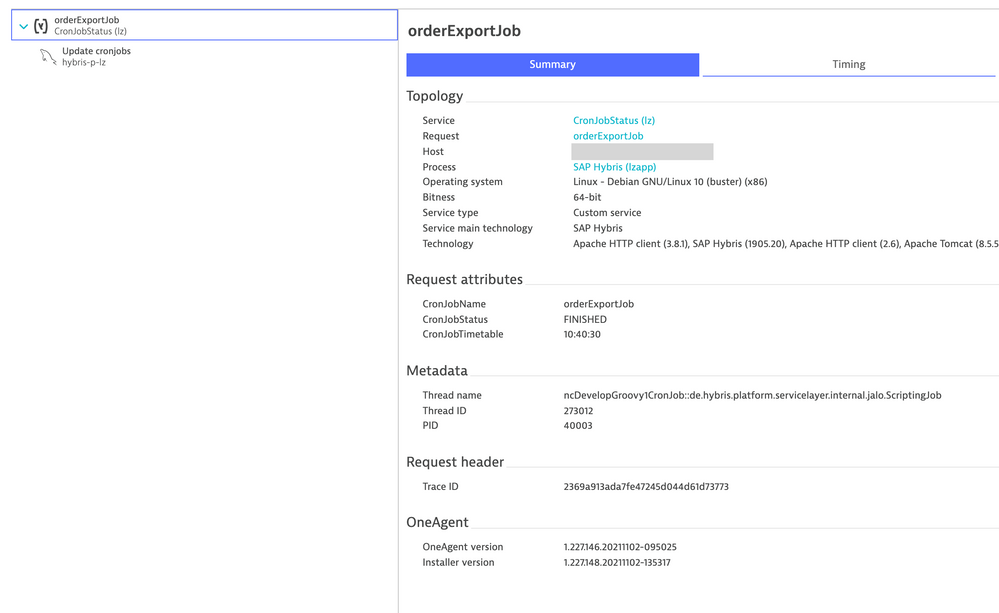
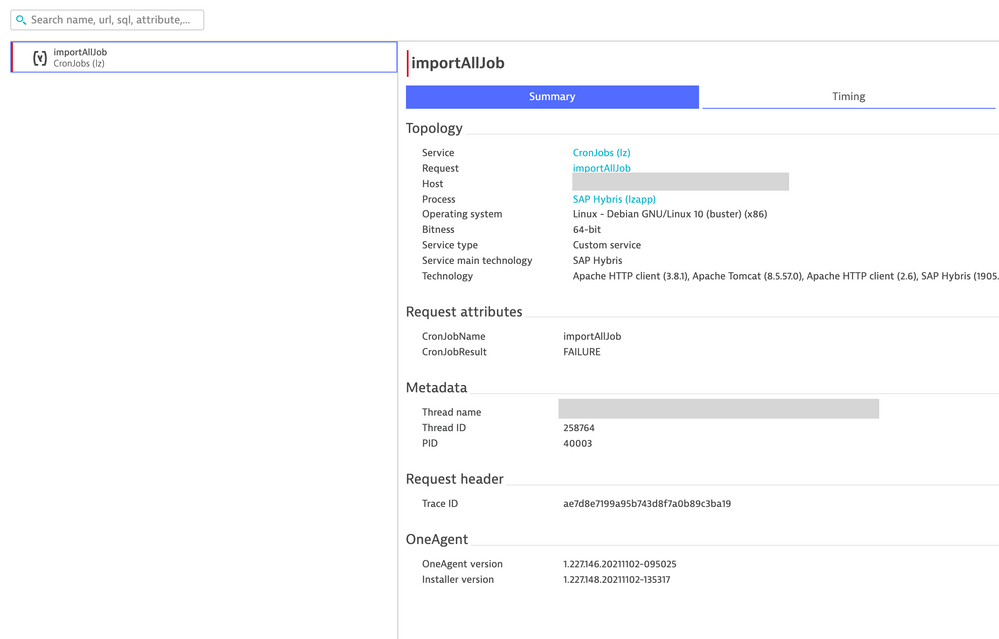
i.e. do not try to track the Job itself as a PurePath, only track the status changes and use a request attribute to get the status. This can be tricky and really depends on the executing code. - find a way to track the result of a job or the failure condition. In My case this is FAILURE, ERROR, OK, SUCCESS)
- Define custom error rules (on key requests) that treat requests based on the result as error or success.
- Define custom metrics for successful executions of these Jobs, split by jobname
- Define custom error events, but with static thresholds. As you said the (new rollup metric function) rolling window doesn't allow for very long timeframes, but it helps in many cases.
For more in detail evaluation I'm using my timeseries streamer to get the above data out of Dynatrace and into a timeseries database (influxDB in my case). There I can use the full logic of flux queries to track things like:
- Job execution time: calculated time between different status events (in Dynatrace this would be two independent PPs without any conjunction, in INfluxDB I can just search for two consecutive events of the same job with different status (start, finished) and calculate the duration.
- Job current status: same as above, calculate if a job has a started event but no finished event. If finished event is missing it is running. This further more allows defining events, if it is running too long you could fire a webhook from your query and ingest an error to Dynatrace 🙂
- Perform any logic to identify if a job did run in any given period (if any status timeseries has been written). If not, trigger an event to Dynatrace that data is missing => alert.
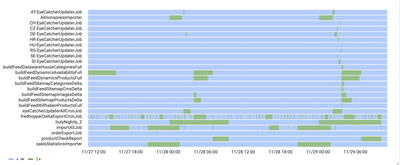
- Visualization bonus: Once the data is out of Dynatrace one can also use some advanced visualization of the data e.g. a swimlane representation of the individual Job execution/frequency and duration like this. This helped me and monitoring teams massively to understand which jobs are running when and where. Combine this with some coloring for job results and you have a good way of showing successes/failures.
My bottom line, it is tricky (still) to trigger events in Dynatrace based on low frequency or missing metrics. For that purpose I get data out of DT into a system where I can perform advanced data manipulation and logic for alerting or visualization..
kr,
Reinhard
- Mark as New
- Subscribe to RSS Feed
- Permalink
25 Jul 2024 10:44 AM
Hi ,
Rollup transformation could be the solution, not necessarily need to use Workflow at first glance.
Please find my post :
[Hack of the week] expand Metric Event duration simply with rollup - Dynatrace Community
Hope it helps
Thanks
- Mark as New
- Subscribe to RSS Feed
- Permalink
25 Jul 2024 11:46 AM
Nowadays we solve this with Business Events and flexible analysis of those combined with SRGs.
- Mark as New
- Subscribe to RSS Feed
- Permalink
25 Jul 2024 12:27 PM
yes indeed, but for additional info this workaround of rollup fit both platform Saas and Managed as well.
- Mark as New
- Subscribe to RSS Feed
- Permalink
25 Jul 2024 07:08 PM
On our side, we have created an extension that looks at the events, and configured options are met, generates problems.
I'm pretty sure there is a Product Idea for this, and this is especially important for Business metrics, of which some might have timeframes like one day...
- Mark as New
- Subscribe to RSS Feed
- Permalink
25 Jul 2024 07:34 PM
We gave up waiting for Dynatrace and deployed a local instance of https://healthchecks.io/. Cronitor is another good option.
Featured Posts


