- Dynatrace Community
- Ask
- Open Q&A
- NEWBIE: Processes on this host are not communicating
- Subscribe to RSS Feed
- Mark Topic as New
- Mark Topic as Read
- Pin this Topic for Current User
- Printer Friendly Page
- Mark as New
- Subscribe to RSS Feed
- Permalink
14 Sep 2022
04:27 PM
- last edited on
15 Sep 2022
11:01 AM
by
![]() MaciejNeumann
MaciejNeumann
Hi community,
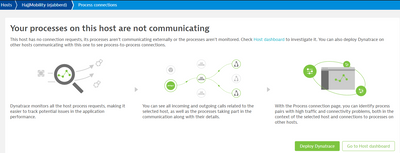
Can anyone kindly explain more about the statement:
"This host has no connection requests, its processes aren't communicating externally or the processes aren't monitored. Check host dashboard to investigate it. You can also deploy Dynatrace on other hosts communicating with this one to see process-to-process connections."
Perhaps with examples or cases when this page will be showed? How do I know if my processes are not connected externally?
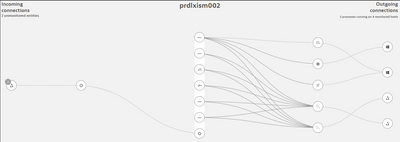
because I was expecting some kind of graphic (see the second picture) instead of "your processes on this host are not communicating".
Your help would be much appreciated, thanks.
-Leona
Solved! Go to Solution.
- Mark as New
- Subscribe to RSS Feed
- Permalink
15 Sep 2022 10:34 AM
Hi @leonatay, I moved your question to Open Q&A sub-forum so more people could see it and provide you with the answer you need.
- Mark as New
- Subscribe to RSS Feed
- Permalink
15 Sep 2022 11:03 AM
This is a typical case for new installations where OneAgent had been deployed to a host and Dynatrace did not yet detect communication with other OneAgent monitored hosts on a process level. I totally agree this is misleading for new users.
The ccommunication between hosts is detected by detecting TCP traffic (oneagentnetwork module) between OneAgent monitored systems. So if you installed a OneAgent on a host and this did not yet communicate using TCP to another OneAgent monitored host, you will see such message.
Communication between services (which is far more important) is detected by instrumenting the deep monitored processes (distributed tracing) which is independent from detecting the traffic on network level.
Featured Posts


