- Dynatrace Community
- Dynatrace
- Ask
- Open Q&A
- Re: PHP Sessions hotspots with Symfony
- Subscribe to RSS Feed
- Mark Topic as New
- Mark Topic as Read
- Pin this Topic for Current User
- Printer Friendly Page
PHP Sessions hotspots with Symfony
- Mark as New
- Subscribe to RSS Feed
- Permalink
14 Apr 2023
03:01 PM
- last edited on
17 Apr 2023
08:59 AM
by
![]() MaciejNeumann
MaciejNeumann
Hi.
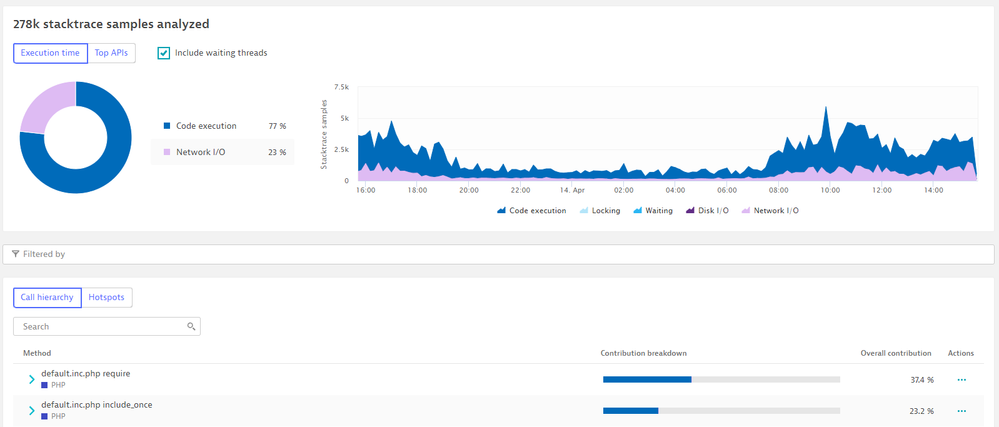
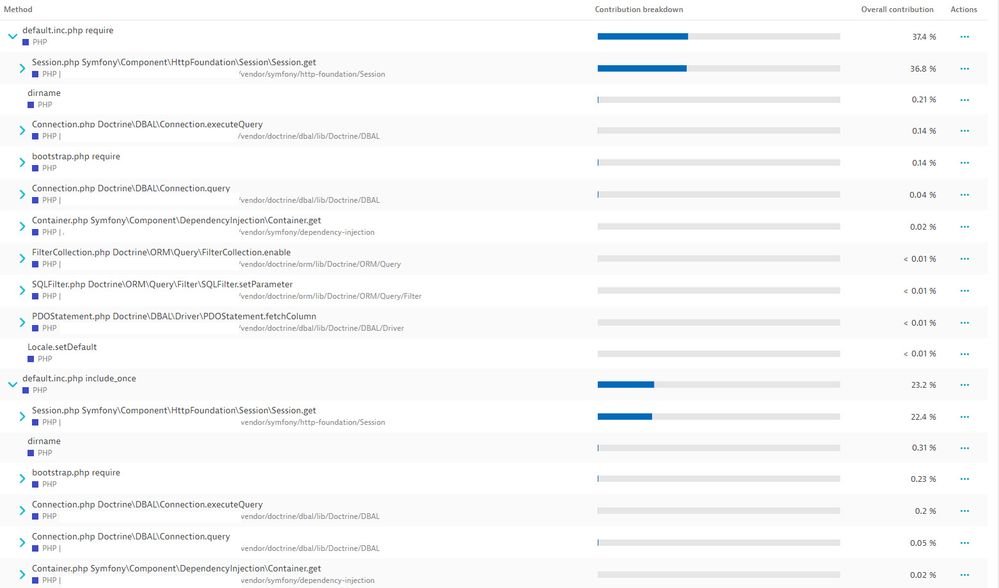
I'm trying to analyze method hotspots on a PHP application using Symfony.
Most of the time, session management seems to be bottleneck, but I can't drill down to be sure of the root cause.
Somebody already has the use case ![]() ?
?
Thanks,
- Labels:
-
application monitoring
-
php
-
user sessions
- Mark as New
- Subscribe to RSS Feed
- Permalink
14 Apr 2023 04:29 PM
Yes, check the Session Management code. It's showing as code, so verify how they are being managed.
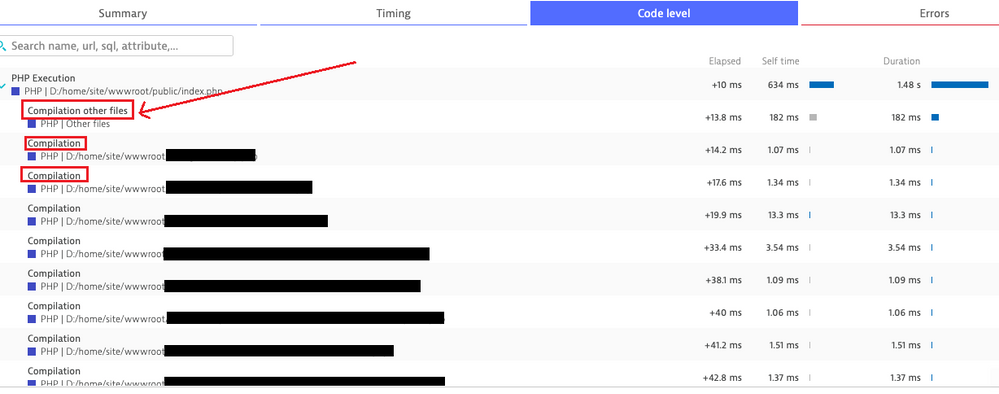
Also, take a look at compilations. There are metrics for that, but you can also check "Code level" in the distributed traces and see them at the beginning of the requests. Had several problems with PHP/Symfony compilations in the past.
- Mark as New
- Subscribe to RSS Feed
- Permalink
17 Apr 2023 01:24 PM
Thanks @AntonioSousa
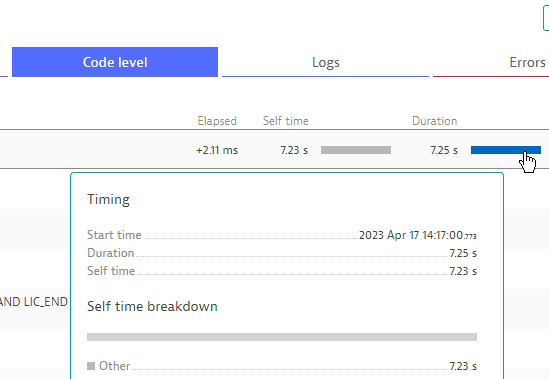
I already try Code Level on some traces, but only Other time is shown.
How to deep dive ?
We tried changing disk where sessions are stored (network disk before, local disk now), but nothing change in response times.
- Mark as New
- Subscribe to RSS Feed
- Permalink
17 Apr 2023 05:09 PM
First of all, it doesn't seem to be Compilations, as the following would have to be appearing:
It seems it might be interesting to see the full Code tab, if you can filter your data. Could you share it?
- Mark as New
- Subscribe to RSS Feed
- Permalink
17 Apr 2023 05:25 PM
Sure.
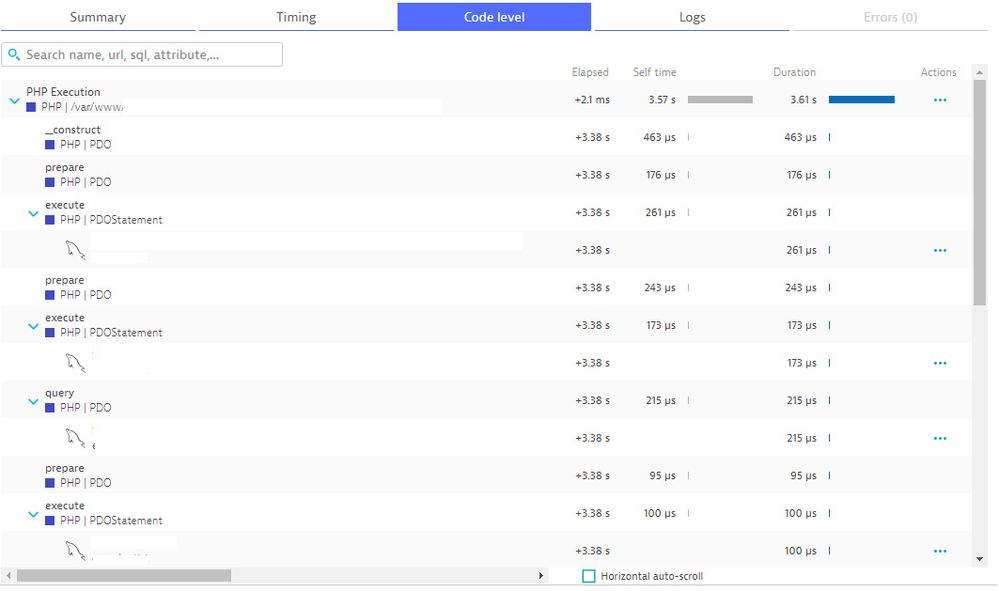
Most of the time, I only see SQL requests after the "Other" time as shown in the following example :
- Mark as New
- Subscribe to RSS Feed
- Permalink
18 Apr 2023 05:49 PM
Given how late the __construct starts, I would check several PHP metrics in Data Explorer, including the ones related to thread and processes. Also check if you are using OPCache?
