- Dynatrace Community
- Ask
- Open Q&A
- Re: Problem Not raised for a service for 100 % failure .
- Subscribe to RSS Feed
- Mark Topic as New
- Mark Topic as Read
- Pin this Topic for Current User
- Printer Friendly Page
- Mark as New
- Subscribe to RSS Feed
- Permalink
03 Mar 2024
02:22 PM
- last edited on
07 Mar 2024
09:10 AM
by
![]() Michal_Gebacki
Michal_Gebacki
Hi Team,
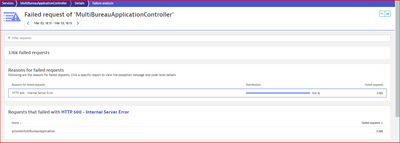
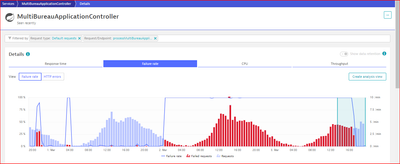
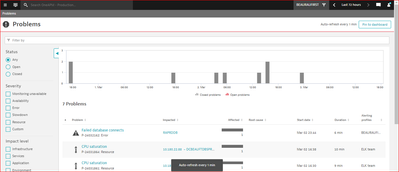
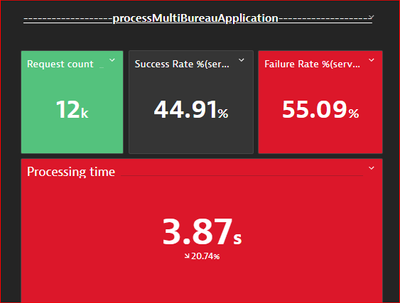
We have observed a 100% failure with http 500 internal server error in a specific service but no problem was raised during the timeframe the baseline is also set at auto-adaptive and during the 7-day timeframe no anomaly was observed. can anyone please guide me on how to approach this issue and help me to resolve it. PFB Snapshots.
Solved! Go to Solution.
- Mark as New
- Subscribe to RSS Feed
- Permalink
03 Mar 2024 08:28 PM - edited 03 Mar 2024 08:35 PM
It seems this is due to not having at least 10 requests per minute. You are looking at 72 hours, so it is aggregated, but I would say it doesn't pass the requirement needed for Davis to raise the problem automatically.
Given it's at the service level, you can adjust sensitivity of anomaly detection by following the configuration hints suggested in:
https://docs.dynatrace.com/docs/platform/davis-ai/anomaly-detection/adjust-sensitivity-anomaly-detec...
- Mark as New
- Subscribe to RSS Feed
- Permalink
03 Mar 2024 08:37 PM
Looking closely at the graph, you can see that a problem was generated yesterday by 3 PM, in a period where the 10 requests/min was probably surpassed.
- Mark as New
- Subscribe to RSS Feed
- Permalink
03 Mar 2024 10:10 PM - edited 03 Mar 2024 10:12 PM
Can you please share your anomaly detection settings for services?, because this happen to us and after TOO many TOO many configurations, we came to the conclusion that (Avoid over-alerting) was making this with the problems and they werent raise as we like.
- for make a "reset" we set the min requests to 0 for the first week and after that 0.1 was something that worked for us.
pd: did you used monaco in that enviroment for migrate or do some settings ?
hope it helps
- Mark as New
- Subscribe to RSS Feed
- Permalink
04 Mar 2024 07:39 AM
Could it be this is detected as a "frequent issue"?
https://docs.dynatrace.com/docs/platform/davis-ai/anomaly-detection/detection-of-frequent-issues
- Mark as New
- Subscribe to RSS Feed
- Permalink
04 Mar 2024 03:12 PM
I would agree with Antonio here, the fact that I see a problem was in fact raised when it appears the raise count also went up; Perhaps the 'Avoid over-Alerting' feature is affecting here and needs to be evaluated - check that you at least have 10 requests per minute and see if that applies.
Secondly, Paco also suggested a very important thing to check which is the 'Frequent issue'; - Open the Service and expand the timeframe (7 or even 30 days) and see if you noticed any raised 'Frequent issue: Failure rate increase'
I believe one of those or both is what's affecting the raised of new problems.
Let us know! 🙂
Featured Posts


