- Dynatrace Community
- Ask
- Open Q&A
- Re: Query details of GraphQL
- Subscribe to RSS Feed
- Mark Topic as New
- Mark Topic as Read
- Pin this Topic for Current User
- Printer Friendly Page
- Mark as New
- Subscribe to RSS Feed
- Permalink
23 Aug 2023 04:08 AM - edited 24 Aug 2023 10:03 AM
Hi team,
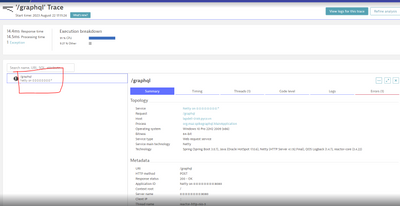
I'm using Java, Netflix DGS, and WebFlux. I want to see what kind of query being made to /graphql (operation name in /graphql endpoint)
But on my test, it wasn’t shown. Could you guys help me?
Many thanks!
Solved! Go to Solution.
- Labels:
-
distributed traces classic
-
graphql
- Mark as New
- Subscribe to RSS Feed
- Permalink
23 Aug 2023 09:39 AM
If you know where in your code or in the library code is the query used, you can configure request attributes capturing the method arguments. You can also use OpenTelemetry instrumentation for GraphQL and have Dynatrace capture the span attributes provided by the OpenTelemetry instrumentation, which is probably the easiest way.
Be sure to check the Observability clinic recording on GraphQL and Dynatrace and how to leverage OpenTelemetry to provide you with more insights into your GraphQL applications.
- Mark as New
- Subscribe to RSS Feed
- Permalink
24 Aug 2023 10:02 AM
Hi @Julius_Loman ,
Thank you for your reply.
Observability clinic is talking GraphQL and Node but I'm using GraphQL in Java so It can't help me now. Could you have any documentation about GraphQL, Java, Netflix DGS, and WebFlux?
- Mark as New
- Subscribe to RSS Feed
- Permalink
24 Aug 2023 10:34 AM
@nhutdangqn there is a section about other languages at https://www.youtube.com/watch?v=_-ZPhwOWzmw&t=1542s , basically mentioning you should use https://github.com/open-telemetry/opentelemetry-java-instrumentation/tree/main/instrumentation/graph... in your project. The docs seys a standalone instrumentation is supported, so you don't need OpenTelemetry Java Agent for it.
Also, be sure to have the OneAgent feature flag for Opentelemetry turned on (OpenTelemetry (Java) ), so Dynatrace can pick up the OpenTelemetry spans.
- Mark as New
- Subscribe to RSS Feed
- Permalink
24 Aug 2023 10:17 PM - edited 24 Aug 2023 10:21 PM
@Julius_Loman and anyone,
does that mean dynatrace doesn't support graphql tracing besides nodejs out of the box?
We assumed it support graphql in general out of the box https://www.dynatrace.com/hub/detail/graphql/.
Thanks in advance.
- Mark as New
- Subscribe to RSS Feed
- Permalink
24 Aug 2023 10:36 PM
Yes , that's correct. Only NodeJS is supported out of box as it is mentioned in the technology support page and also on the hub page. For traces from other languages you need to use either opentelemetry or create a custom instrumentation with the otel being a recommended approach.
- Mark as New
- Subscribe to RSS Feed
- Permalink
30 Sep 2024 10:10 AM
Our team has included operation name in the logs with following steps:
1. define global request attribute
2. inject custom attribute with one agent sdk
@Component
@RequiredArgsConstructor
public class DynatraceGraphQlInstrumentation extends SimplePerformantInstrumentation {

    private final OneAgentSDK oneAgentSDK;

    @Override
    public @NotNull ExecutionContext instrumentExecutionContext(
            ExecutionContext executionContext,
            InstrumentationExecutionParameters parameters,
            InstrumentationState state) {
        oneAgentSDK.addCustomRequestAttribute("graphqlOperationName", executionContext.getOperationDefinition().getName());
        return super.instrumentExecutionContext(executionContext, parameters, state);
    }

}
3. define global request naming rule with the API. This makes operation name became visible in the request name. Docs https://docs.dynatrace.com/docs/dynatrace-api/configuration-api/service-api/request-naming-api.
Final result:
Featured Posts


