- Dynatrace Community
- Ask
- Open Q&A
- Re: Request count of Percentile 90 Response Time
- Subscribe to RSS Feed
- Mark Topic as New
- Mark Topic as Read
- Pin this Topic for Current User
- Printer Friendly Page
- Mark as New
- Subscribe to RSS Feed
- Permalink
13 Feb 2023
07:45 PM
- last edited on
14 Feb 2023
08:08 AM
by
![]() MaciejNeumann
MaciejNeumann
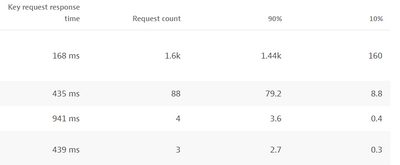
Guys, I have a dashboard with some response time measurements and one of them is the 90th percentile. I have the time, OK, but I was asked how many calls are within that time, within the P90. I didn't find a way to verify this and chatting with the chat, I wasn't given a solution either. Does anyone have an idea how to extract this information?
I need to know how many calls were inside that P95:
builtin:service.keyRequest.response.server:filter(and(or(in("dt.entity.service_method",entitySelector("type(service_method),entityName.equals(~"{keyrequest}~")"))))):splitBy():percentile(95.0):auto:sort(value(percentile(95.0),descending)):limit(100)
Thank you
Solved! Go to Solution.
- Labels:
-
metrics
-
request attributes
- Mark as New
- Subscribe to RSS Feed
- Permalink
27 Feb 2023 01:34 PM
Hi there,
I'm not sure if this is possible within the standard dashboarding. What you can do is create a multidimensional analysis to check it. So firstly use the query above to get the value, then use the Multidimensional Analysis to get the number of calls.
This will give you the number.
KR.
Michiel
- Mark as New
- Subscribe to RSS Feed
- Permalink
27 Feb 2023 05:30 PM
If I got your question right - I believe you have the answer already - for 90 percentile - 90% of requests are below the 90 percentile. Same for any percentile. So you can use the builtin:service.keyRequest.count.server metric for the number. But that's for metrics which have 1-minute resolution, not for individual requests see @michiel_otten answer. - this will be the most precise answer, but you can't have that on a dashboard.
- Mark as New
- Subscribe to RSS Feed
- Permalink
28 Feb 2023 06:24 AM
To add on Julius: you can combine your data explorer query with metric:
(builtin:service.keyRequest.count.total:splitBy("dt.entity.service_method")*0.9) for for fast request count
(builtin:service.keyRequest.count.total:splitBy("dt.entity.service_method")*0.1) for slowest 10%
Tried playing around with percentile in metric above but does not seem to give the right number.
@Julius_Loman what's your experience with this?
- Mark as New
- Subscribe to RSS Feed
- Permalink
28 Feb 2023 07:19 PM
Metric precision will never match the MDA since with metrics you work with 1-minute resolution aggregates at minimum. With MDA it's per request, and it will provide the most accurate answer.
- Mark as New
- Subscribe to RSS Feed
- Permalink
04 Mar 2025 08:51 AM
Hi Everyone;
I wonder how I can get only the number of those over 5 seconds when getting keyrequest count here? Do you have an example? I want to get it from Data Explorer, not MDA.
Regards.
Ozkan
- Mark as New
- Subscribe to RSS Feed
- Permalink
04 Mar 2025 09:52 AM
Yes it is possible with calculated service metrics https://docs.dynatrace.com/docs/shortlink/calculated-service-metric and similarly soon with traces in grail (Dynatrace SaaS only).
Featured Posts


