- Dynatrace Community
- Ask
- Open Q&A
- Re: Response time analysis doesn't provide detailed breakdown
- Subscribe to RSS Feed
- Mark Topic as New
- Mark Topic as Read
- Pin this Topic for Current User
- Printer Friendly Page
- Mark as New
- Subscribe to RSS Feed
- Permalink
19 Dec 2017 05:43 PM
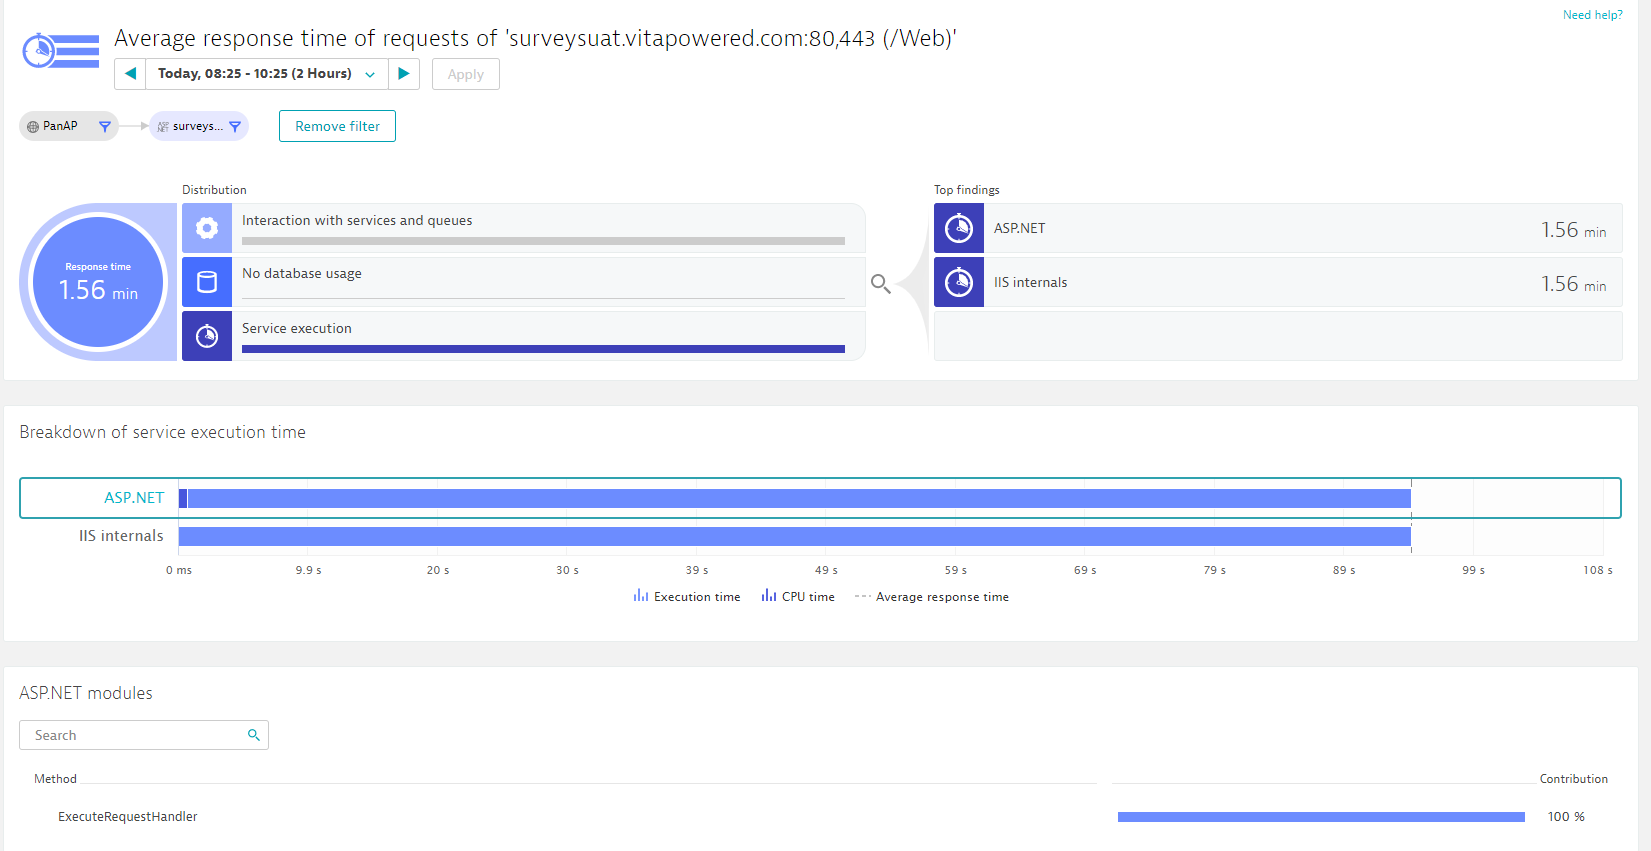
I am setting up Dynatrace for the first time, and as part of it, I am trying to diagnose an issue in our pre-prod environment. According to the Waterfall Analysis, there is a Document Request that is taking 94 seconds. When I click on Pure Path for the call, it shows "service execution" with two Top Findings, ASP.Net and IIS Internals (both showing 1.56 min). If I click on IIS Internals, it shows nothing. If I click on ASP.Net, it shows that 100% of the time is in ExecuteRequestHandler (screenshot attached). Is this expected behavior? Per the documentation, it shows that there should be a detailed breakdown of calls under the ASP.Net Modules, but I am not getting them. Is that due to a configuration error, or is that a result of the application being monitored?

Solved! Go to Solution.
- Mark as New
- Subscribe to RSS Feed
- Permalink
20 Dec 2017 04:14 PM
Hi Ryan,
I have seen similar behavior. I believe the ASP.NET time often will show up only under "ExecuteRequestHandler", but that seems to always be the end of the clue trail every time I have had this type of bottleneck.
Thanks,
dave
- Mark as New
- Subscribe to RSS Feed
- Permalink
27 Apr 2018 03:15 PM
I see the same at our side, did you figure something out?
- Mark as New
- Subscribe to RSS Feed
- Permalink
27 Apr 2018 03:23 PM
Yeah, a while back, our application was encountering issues when Dynatrace was running and I was in a long troubleshooting session (multiple months) with Dynatrace support. Along the way, they flipped a number of switches in an attempt to isolate and troubleshoot the issue. Along the way, they set this flag for our managed instance on their side:
sampling.dotnet.enabled = false
And it was left that way. This was restricting a lot of data we should have been receiving from our applications.
In addition, it sounds like a recent policy change dictates that .Net Framework and .Net Core .dlls will not have the deep monitoring enabled by default, so that needs to be enabled manually. Once we had them change the above flag and enabled the monitoring on the handful of suspect .dlls, we started getting a lot more information.
- Mark as New
- Subscribe to RSS Feed
- Permalink
02 May 2018 01:38 PM
Me too, it SEEMS like 'IIS Internal' not only has no code, but also somehow not being calculated into the response time? I see many such instances in my Managed Environment something like this (where the IIS Internal's time alone is way more than the response time):

Anyone also encountered this?
- Mark as New
- Subscribe to RSS Feed
- Permalink
29 Jul 2018
04:38 PM
- last edited on
16 Oct 2023
03:59 PM
by
![]() random_user
random_user
Saw that too , already asked about it https://community.dynatrace.com/questions/203318/view.html with no answer till now 😞
Yos
- Mark as New
- Subscribe to RSS Feed
- Permalink
24 Jul 2018 09:21 PM
hi there,
we also have this same issues. we also noticed the framework version for .NET is 3.5 can this be an issue of this version? could it be that newer versions of .NET can will show detailed info?
just asking... i cannot find any info about what framework version is supported to give this detailed info about IIS Internals.
RKPO
- Mark as New
- Subscribe to RSS Feed
- Permalink
30 Jul 2018
07:47 AM
- last edited on
23 Mar 2023
01:04 PM
by
![]() MaciejNeumann
MaciejNeumann
.NET 3.5 is still supported (you can find it here: https://www.dynatrace.com/support/help/technology-support). It also has CPU Sampling technology enabled, so you should see method hotspots for .NET.
As to the "IIS Internals". This usually is the time a request is processing/waiting in IIS, before it is actually picked up by a CLR thread to be processed. In my experience this time is usually spent if all .NET thread pools threads are busy and IIS needs to wait for them. Of course the reason could as well be another native IIS module consuming time.
Featured Posts
