This website uses Cookies. Click Accept to agree to our website's cookie use as described in our Privacy Policy. Click Preferences to customize your cookie settings.
Open Q&A
If there's no good subforum for your question - ask it here!
Turn on suggestions
Auto-suggest helps you quickly narrow down your search results by suggesting possible matches as you type.
- Community Home
- Platform
- Open Q&A
- Set up a compare of 2 time periods
Options
- Subscribe to RSS Feed
- Mark Topic as New
- Mark Topic as Read
- Pin this Topic for Current User
- Printer Friendly Page
Options
- Mark as New
- Subscribe to RSS Feed
- Permalink
20 Sep 2018
10:31 AM
- last edited on
30 Aug 2022
01:14 PM
by
![]() MaciejNeumann
MaciejNeumann
In our Production system we have seen the CPU usage more than double overnight with no deployment or changes we are aware of happening.
I want to set up a time comparison in Dynatrace for 2 different 1 hour periods 1 day apart so i can easily review what the servers are doing differently to see where the problem may be.
Even better if Dynatrace can report on the biggest changes in what is using the CPU.
Thanks in Advance.
Solved! Go to Solution.
Labels:
- Labels:
-
services classic
Reply
1 REPLY 1
Options
- Mark as New
- Subscribe to RSS Feed
- Permalink
21 Sep 2018 08:20 AM
You can use the Compare button which is available as a drill down in most of the Dashboards.
Here is an example from the service overview:
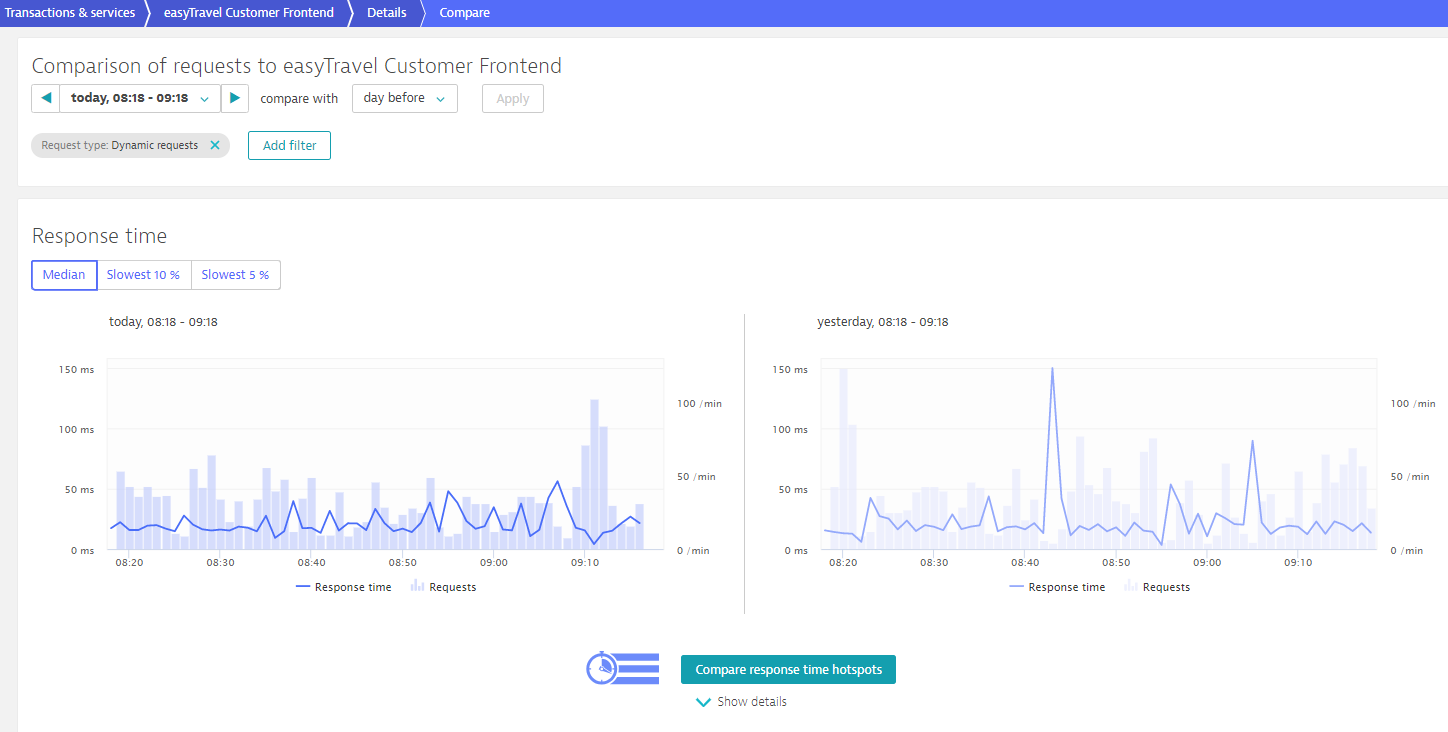
If you drill down via the Compare repsonse time hotspots you get the difference in CPU consumption you want, if that is a major factor of the response time.
Dynatrace Certified Master - Dynatrace Partner - 360Performance.net
Featured Posts
