- Dynatrace Community
- Ask
- Open Q&A
- Re: Using thresholds in data explorer calculations
- Subscribe to RSS Feed
- Mark Topic as New
- Mark Topic as Read
- Pin this Topic for Current User
- Printer Friendly Page
- Mark as New
- Subscribe to RSS Feed
- Permalink
23 Mar 2023
07:44 PM
- last edited on
27 Mar 2023
11:24 AM
by
![]() Ana_Kuzmenchuk
Ana_Kuzmenchuk
We want to create a health score for an application based on multiple KPIs and their respective weights.
For simplicity, let's say we have two KPIs: i/o wait time and CPU memory usage percentage.
The weights for each are 6/10 and 4/10 respectively.
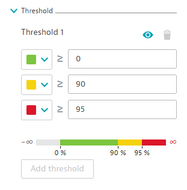
We set the thresholds for i/o wait time as follows:
and CPU memory usage percentage thresholds as follows:
I'd like to set the following values to each threshold: green - 100, yellow - 75, red - 0.
So if i/o wait time is 8% and memory usage is 87% our health score would look as follows:
75(6/10)+100(4/10) = 85
Is there a way to include thresholds as I've described into Data Explorer calculations?
Solved! Go to Solution.
- Labels:
-
data explorer
-
metrics
- Mark as New
- Subscribe to RSS Feed
- Permalink
27 Mar 2023 08:24 AM
Hi Paulito,
Unfortunately, from Data Explorer, there is no way that the set thresholds on the charts generate problems. This is a convenience for analyzing the charts, so that you can quickly verify whether the thresholds are exceeded or not.
If you want to create alerts for these metrics (or new ones) you can use Metric Events: https://www.dynatrace.com/support/help/observe-and-explore/davis-ai/anomaly-detection/metric-events
Regards,
Radek
- Mark as New
- Subscribe to RSS Feed
- Permalink
27 Mar 2023 04:05 PM
Sorry, I wasn't clear enough. I do not want these thresholds to generate problems I simply want to use them in calculations. I want to create a tile in a dashboard that changes value based on thresholds of KPIs.
This doesn't seem possible right now though.
- Mark as New
- Subscribe to RSS Feed
- Permalink
27 Mar 2023 07:31 PM
Assuming you are handling with same units, maybe you can try some crazy math with Metric Expressions: https://www.dynatrace.com/support/help/observe-and-explore/explorer/explorer-advanced-query-editor#e...
The thresholds will be set based on its results and may fit your needs.
Featured Posts


