- Dynatrace Community
- Ask
- Open Q&A
- Traces on Grail: getting the "processing" time
- Subscribe to RSS Feed
- Mark Topic as New
- Mark Topic as Read
- Pin this Topic for Current User
- Printer Friendly Page
- Mark as New
- Subscribe to RSS Feed
- Permalink
16 Apr 2024 03:55 PM
I was just asking myself how to get the overall processing time of a trace. In Grail spans and traces all have a duration field but there is no knowledge of what runs asynchronously or sequentially.
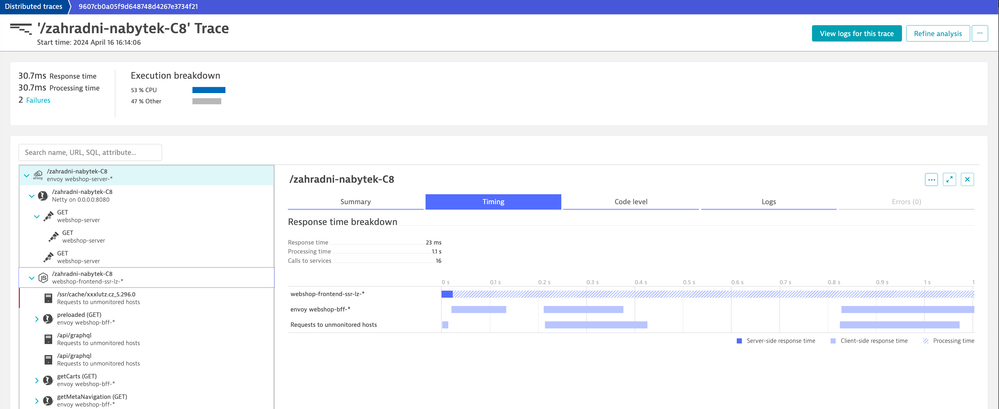
Imagine this trace in the UI:
With the async stuff going on the "response time" is 30.7ms. One can see this on the root span of the trace as well. But then there are a lot of async calls and the actual time I'd be interested is the "Processing time" which is ~1s.
If I want to know how much time is spent on a individual service int total I can't just sum up the "duration" of these service calls, neither can I add up all span durations for the overall duration of the trace?
Any ideas how to solve this? How could one get the duration/processing time of this trace using a query?
Solved! Go to Solution.
- Labels:
-
distributed traces classic
- Mark as New
- Subscribe to RSS Feed
- Permalink
10 Dec 2024 07:54 PM
anyone figured this out?
- Mark as New
- Subscribe to RSS Feed
- Permalink
24 Jan 2025 01:28 PM
@r_weber the processing time as you describe it would be the difference of the earliest start and latest end time of the spans of a trace when I got your question right. If you want to have this also for the spans of a the services within a trace you need to make a multi step summarize query.
I tried this in DQL and would get this result.
fetch spans
| summarize {request.start_time = min(start_time),
request.end_time = max(end_time)}, by: {trace.id, dt.entity.service}
| summarize {trace.start_time = min(request.start_time),
trace.end_time = max(request.end_time),
request.processing_times = collectArray(record(dt.entity.service, request.start_time, request.end_time, request.processing_time = request.end_time-request.start_time))}, by: {trace.id}
| fieldsAdd trace.processing_time = trace.end_time - trace.start_time
Does this help? For a single trace you could add a trace.id filter right after the fetch.
Featured Posts


