- Dynatrace Community
- Ask
- Open Q&A
- What is the difference between users impacted and affected by an error?
- Subscribe to RSS Feed
- Mark Topic as New
- Mark Topic as Read
- Pin this Topic for Current User
- Printer Friendly Page
- Mark as New
- Subscribe to RSS Feed
- Permalink
08 Dec 2022
08:39 AM
- last edited on
19 Jun 2023
12:13 PM
by
![]() Karolina_Linda
Karolina_Linda
Hi all,
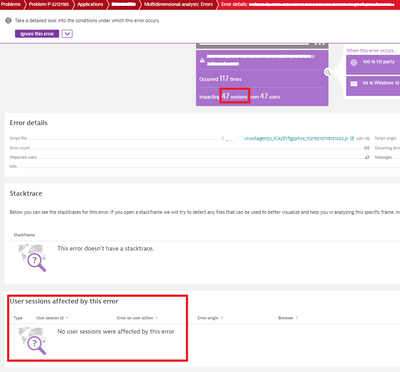
47 User sessions impacted, but "no user sessions were affected by this error"?
Solved! Go to Solution.
- Mark as New
- Subscribe to RSS Feed
- Permalink
11 Dec 2022 09:45 PM
Hi @yair_mashmor,
The number of impacted users in the problem card is the number of "Observed Users" i.e. refers to the potentially impacted users. These are the users that have been observed to be using the app in that timeframe.
For example, If you experience a backend issue you probably might be interested in the number of users that were observed accessing those specific traces. It's not that we simply show 'ALL' users. It's specific users for the app that is affected by the backend service issue, hitting user actions being on the same pure path at the time we detected that problem.
However, when you try to drill it down to the affected users, it shows a different number/no users as the source is different. Davis is using a different data storage to calculate the potentially impacted users than the USQL. In this case (based on your screenshot), looks like there were no users who faced any HTTP error or were affected by this problem in using the application.
Hope this helps.
Kind regards,
Abhi
- Mark as New
- Subscribe to RSS Feed
- Permalink
27 Nov 2023 12:01 PM
Adding to this thread, investigating a similar question.
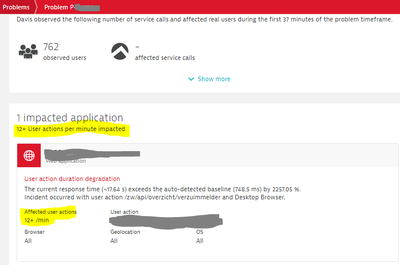
Wondering why the problem card header (with 1 impacted app) shows 12+ user actions impacted.
But the problem detail window of the web service shows 12+ Affected user actions.
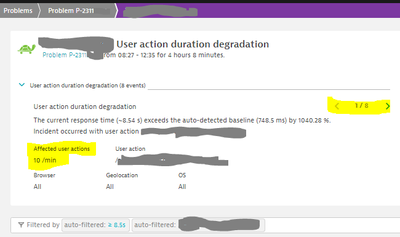
The Problem detail screen of the degradation:
indicates 10/min Affected user actions (not 12+?), and (only?) 8 events.
Not clear if these/what user actions where impacted, when it only states affected.
Featured Posts


