- Dynatrace Community
- Ask
- Open Q&A
- Re: Windows System consuming 80% + of CPU Resource, how to further troubleshoot in Dynatrace?
- Subscribe to RSS Feed
- Mark Topic as New
- Mark Topic as Read
- Pin this Topic for Current User
- Printer Friendly Page
- Mark as New
- Subscribe to RSS Feed
- Permalink
04 Jun 2021
09:24 AM
- last edited on
25 Oct 2023
02:34 PM
by
![]() MaciejNeumann
MaciejNeumann
Windows System consuming 80% + of CPU Resource, how to further troubleshoot in Dynatrace?
(other than asked customer to open task manager to have a look)
Best,
Wai Keat
Solved! Go to Solution.
- Mark as New
- Subscribe to RSS Feed
- Permalink
04 Jun 2021 11:56 AM
That's a good question. I don't think you can break 'Windows System' out further in Dynatrace.
- Mark as New
- Subscribe to RSS Feed
- Permalink
04 Jun 2021 01:17 PM
Yep, which makes alerting about it a bit problematic. We also often see "Packet retransmission rate for process Windows System on host asdf has increased to 10 %". Seems like the best option is to just suppress these alerts, because there's nothing you can do with that information. ...Or if someone has ideas, do let me know 🙂
- Mark as New
- Subscribe to RSS Feed
- Permalink
04 Jun 2021 03:17 PM
One idea might be to look at the Windows logs at the host level in Dynatrace. Might find an indication of something that might be going on. Also, take a look at the number of DNS queries, as it has surprised me in some occasions.
- Mark as New
- Subscribe to RSS Feed
- Permalink
05 Jun 2021 09:28 AM
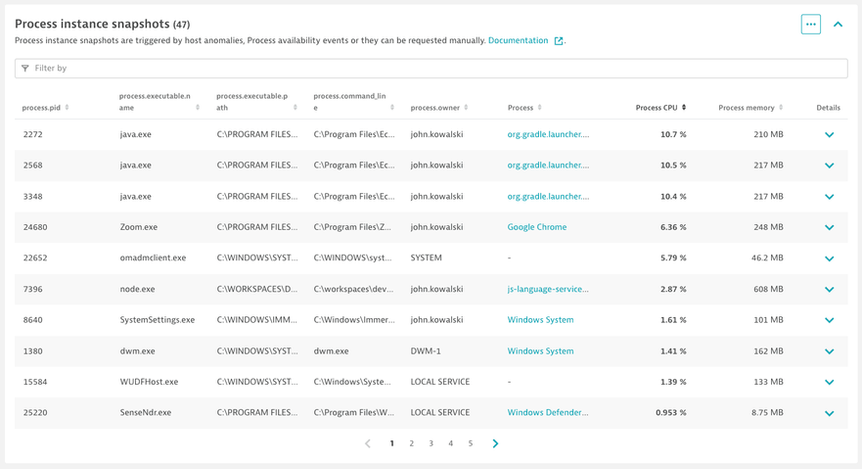
There is a way to figure out which processes are include under windows system from SA.
Go to diagnostic files --> Agent --> logs --> os and open processesSnapshot.log
In this file look for Group name: Windows System, under it you will find all the windows processes that OA collect together.
You will see for each process last CPU val and Virtual memory peak size and can get a clue on which process is consuming more CPU and Memory than others.
HTH
Yos
- Mark as New
- Subscribe to RSS Feed
- Permalink
02 Mar 2023 10:54 PM
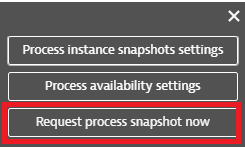
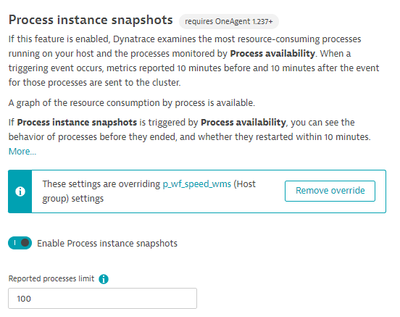
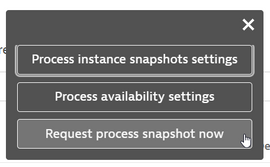
To get a process snapshot you can enable automatic process snapshots that run based on any of these triggering events or you can run a snapshot manually by selecting ... in the Process Snapshots section on a specific host page.
- High host CPU usage
- High host memory usage
- High packet drop rates
- High NIC utilization rates
- High number of NIC errors
- Process availability events
- Mark as New
- Subscribe to RSS Feed
- Permalink
24 Oct 2023 11:59 AM


Thanks.
- Mark as New
- Subscribe to RSS Feed
- Permalink
24 Oct 2023 10:17 PM - edited 24 Oct 2023 10:18 PM
Hi Maximus,
Please confirm that the OneAgent is on the supported version of 1.237 or higher.
https://www.dynatrace.com/support/help/shortlink/host-monitoring-new#snapshots
Otherwise, if you reloaded the page and the snapshot was not there, please open a DynatraceOne Chat or Support Ticket for further assistance.
https://support.dynatrace.com/
- Mark as New
- Subscribe to RSS Feed
- Permalink
26 Oct 2023 08:58 AM
Hello,
The agent version is 1.239.
I have contacted support and this is their answer:
"Could you please update the OneAgent running on the host to at least version 1.251? The version of OneAgent currently running on the host is not supported.
With the release of OneAgent version 1.275, our oldest supported version is 1.251: https://www.dynatrace.com/support/help/shortlink/release-notes-oneagent-sprint-275
The version number next to the process instance snapshot function corresponds to the date on which the function was introduced".
That doesn't help me 🙂
Regards
Featured Posts


