- Dynatrace Community
- Ask
- Open Q&A
- Re: Wrong Min/max instance response time on Custom defined Java service
- Subscribe to RSS Feed
- Mark Topic as New
- Mark Topic as Read
- Pin this Topic for Current User
- Printer Friendly Page
- Mark as New
- Subscribe to RSS Feed
- Permalink
18 Apr 2018 08:22 AM
Hi
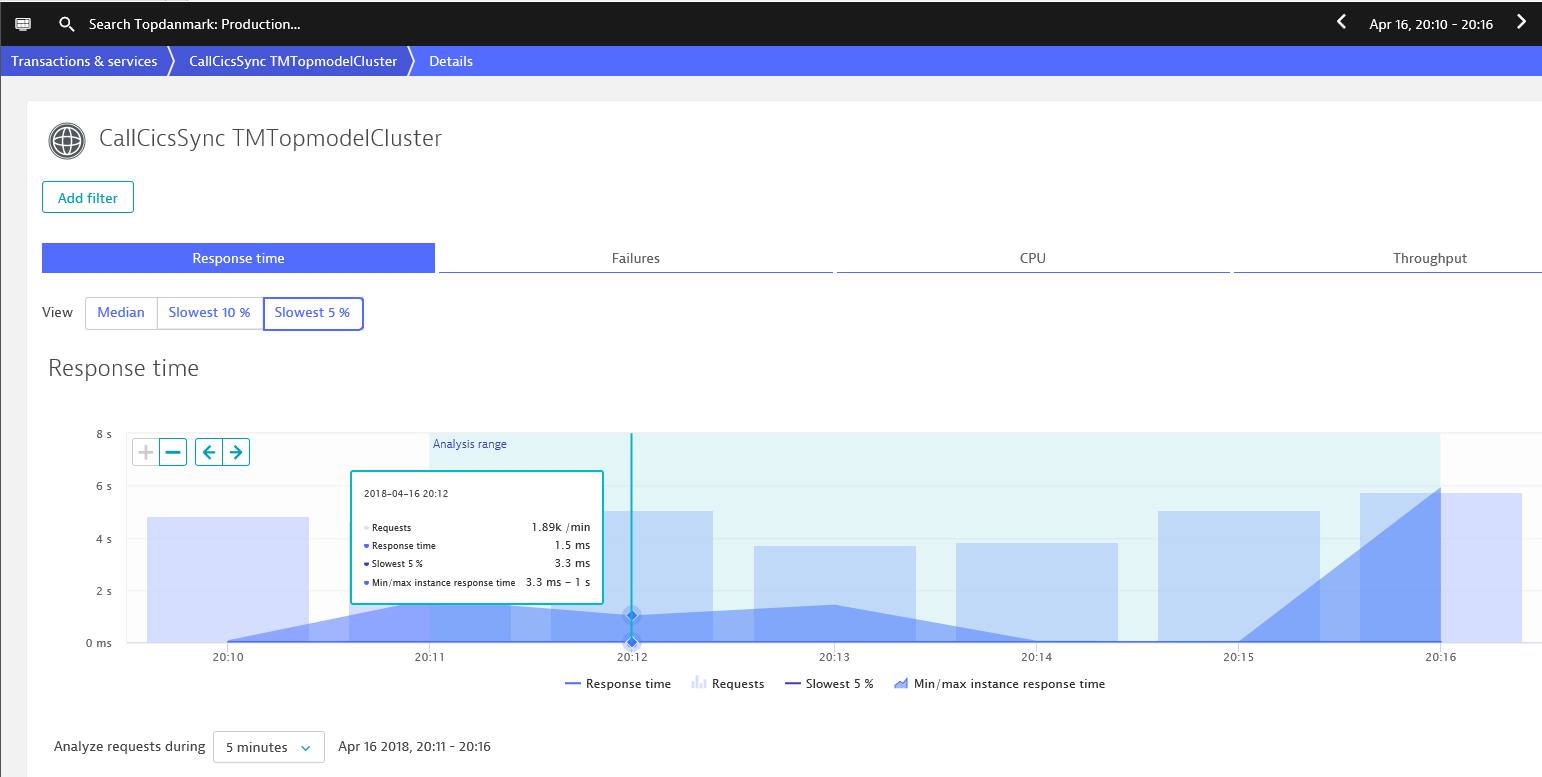
I have a custom defined Java Service defined in Dynatrace, that monitors a single method in a specific Java class. When I go to this service details view and look at the response times, the Min/max instance response time shows a max on approx 2 seconds:

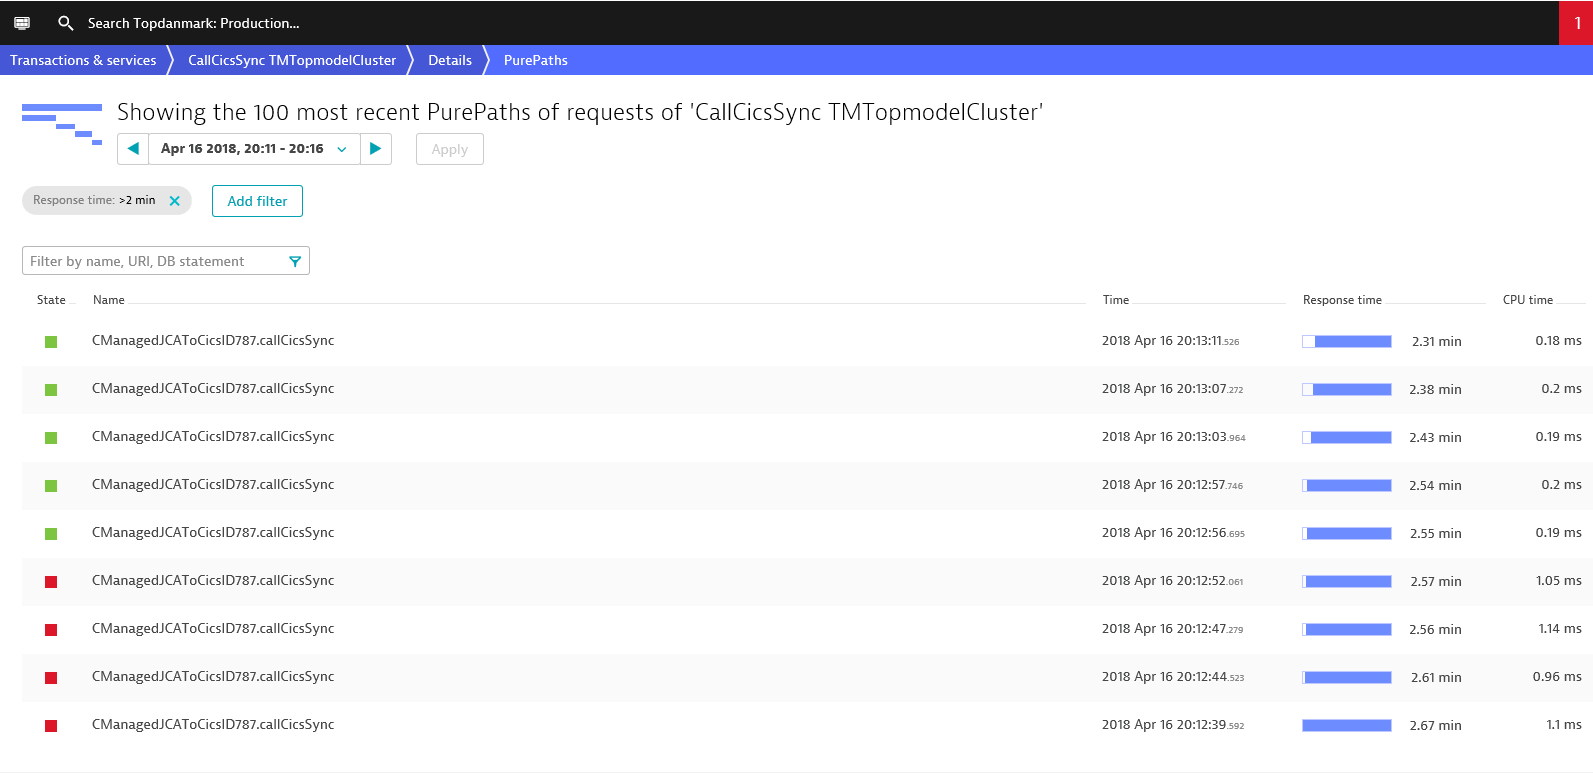
But if I go further into the purepaths and add a filter showing only purepaths with a response times greater than 2 minutes, I get a number of purepaths:

Why are these high response times not shown in the Min/max response times on the details view?
Solved! Go to Solution.
- Labels:
-
java
-
services classic
- Mark as New
- Subscribe to RSS Feed
- Permalink
18 Apr 2018 08:49 AM
Which version do you have? I don't have min/max response times in the service details chart on both Dynatrace Managed 1.140 and Dynatrace SaaS 1.142. Isn't this turned on by a feature flag?
- Mark as New
- Subscribe to RSS Feed
- Permalink
18 Apr 2018 08:57 AM
The min/max is shown only for services with multiple instances. The minimum shows the avg. of the lowest instances, the max the avg. instance of the highest instance.
It should show up for you if you look at a service with more then one instance.
- Mark as New
- Subscribe to RSS Feed
- Permalink
18 Apr 2018 04:47 PM
Almost, it shows the median of the fastest instance and the median of the slowest instance as a funnel.
If you switch to Slowest 5%, which is the 95pct, then it shows the 95% of the slowest instance and the fastest.
The idea is to get an instance spread.
- Mark as New
- Subscribe to RSS Feed
- Permalink
23 Apr 2018 05:22 PM
Yeah, rigth. I'm still living in the old appmon world with averages 😉
- Mark as New
- Subscribe to RSS Feed
- Permalink
18 Apr 2018 08:56 AM
Our Securty Gateway are version 1.333 and Our OneAgents are version 1.135
I'm pretty sure that I didn't do anything to turn Min/max response times on, I think it came out of the box
- Mark as New
- Subscribe to RSS Feed
- Permalink
18 Apr 2018 08:59 AM
Yes it is, see my comment above. I'm not sure what could cause this difference in time between the service and PurePath though, if the custom service has only this one entry point.
- Mark as New
- Subscribe to RSS Feed
- Permalink
18 Apr 2018 09:23 AM
I had only single instance services with custom java service defined.
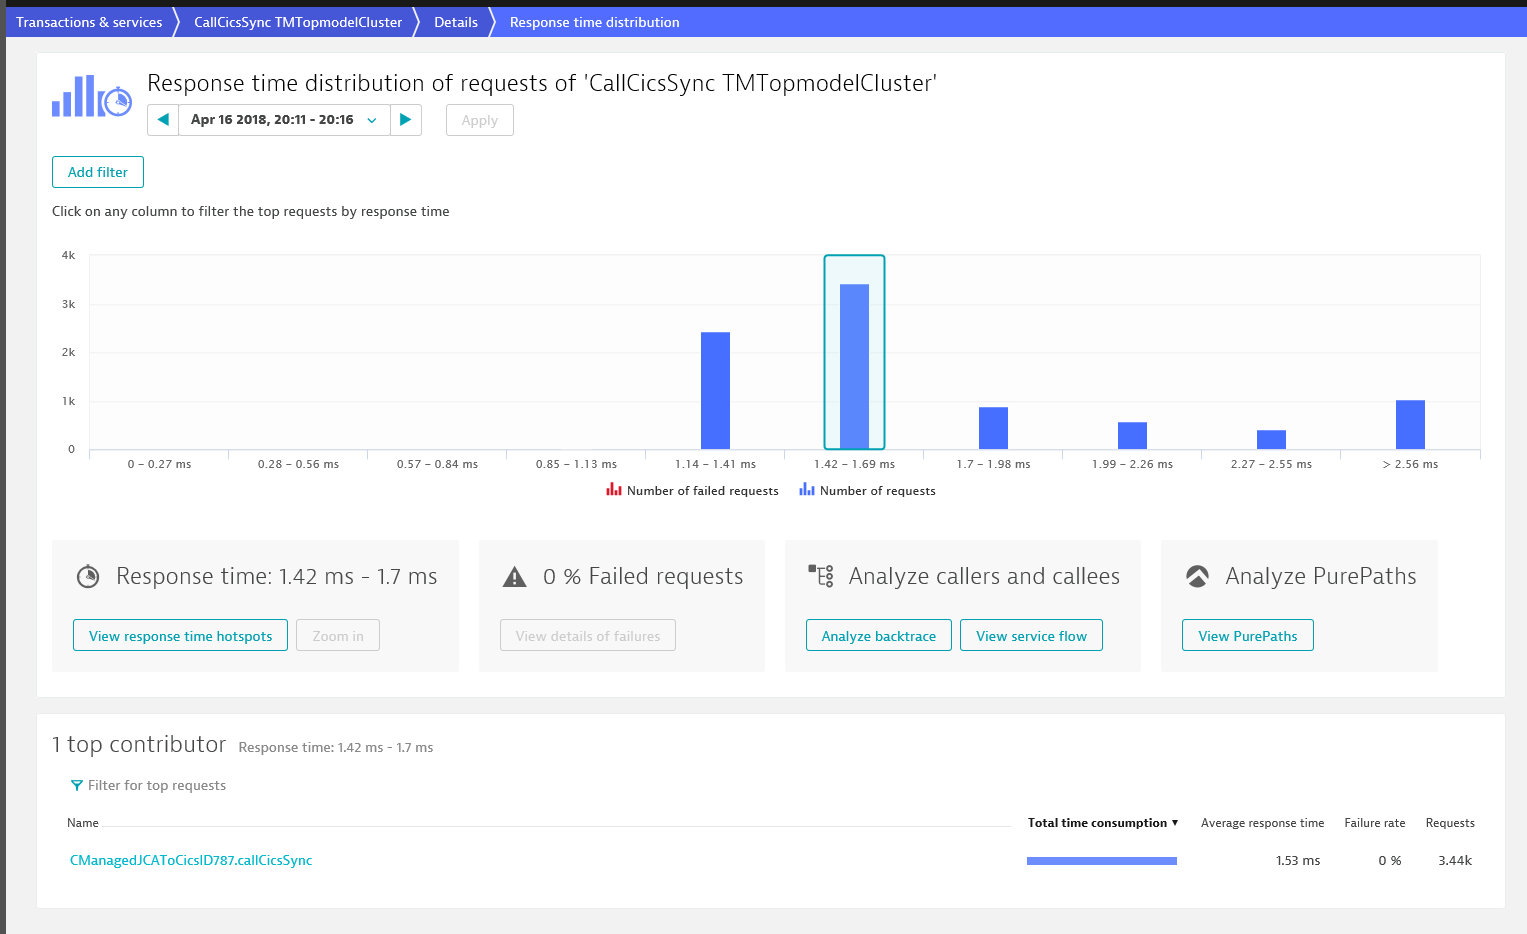
The only explanation I have is that the Dynatrace calculates average response on every instance and the Min/Max is the min/max of those averages, not the min/max response time of individual requests. Since there is a high number of requests (1.89k/min) to your service, those ">2min requests" can easily hide if there are not many of them and most requests are fast. How does your response time distribution look like? (The analyze outliers button)
- Mark as New
- Subscribe to RSS Feed
- Permalink
18 Apr 2018 04:48 PM
Hi See my other comment. we calculate median, 90th and 95th of every instance. When you look at the median, the funnel shows the funnel es the slowest/fastest instance on the median, so it gives the spread across instances.
- Mark as New
- Subscribe to RSS Feed
- Permalink
18 Apr 2018 10:44 AM
I guess you're right 🙂 But it would be nice if someone from Dynatrace could verify this behaviour.
The Analyze Outlier isn't any better:

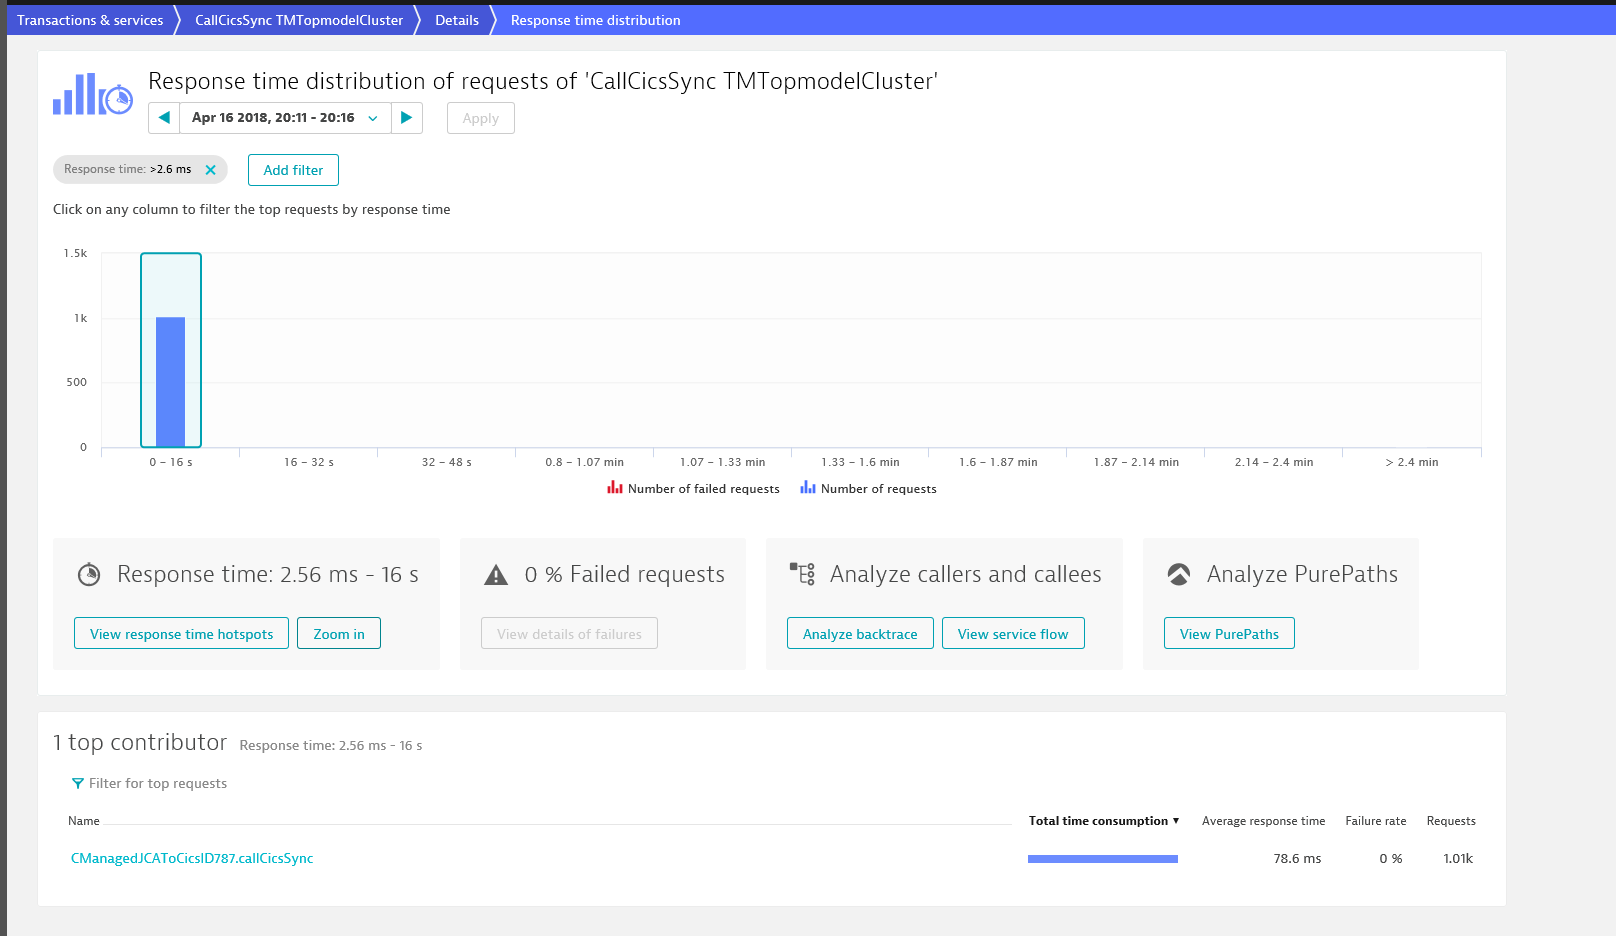
And even if I zoom in on the > 2.56 ms requests, I'm not being made aware on any really slow requests:

- Mark as New
- Subscribe to RSS Feed
- Permalink
18 Apr 2018 10:55 AM
How many requests are in those buckets above 16s? Based on the screenshot it looks there just a few of them in each bucket.
This is the case when response time distribution is handy. Overall you service performs quite well, but few requests are really slow. How does your service flow look like in general and for those very slow requests? Then you could track down the issue.
This might be the case you have put your custom java service on a very high level and a lot of processing happens inside your service and just one flow causes problems.
- Mark as New
- Subscribe to RSS Feed
- Permalink
18 Apr 2018 12:29 PM
There are between 0 and 4 requests in the buckets above 16s, so no wonder that they disappear when the averages are calculated 🙂 Actually my custom service are created on a very low level, only showing one Java method which is calling our z/OS mainframe. And the long response times are due to locks in DB2 (on z/OS), so in this case, I'm not using Dynatrace to figure out if/why Java is slow.
The real problem here, is that we had an understanding of the min/max response time, as the absolute minimum and maximum response time, so that we directly from the details view could see if there was any very slow requests. Now I know that I have to go into the Analyze Outliers view
- Mark as New
- Subscribe to RSS Feed
- Permalink
19 Apr 2018 01:47 PM
Hi Michael
thank you for the clarification 🙂 A suggestion would be to update the documentation with some kind of reference section, where all these metrics was documented. It would save both your customers and yourself a lot of time. I actually had to do both a post on this forum and since I didn't get any reply, write to support, to get an answer to the simple question: How often do Dynatrace sample the CPU usage on a host? Like the Min/max response time, it wasn't documented anywhere (at least not anywhere I could find it :-))
Featured Posts
