- Dynatrace Community
- Ask
- Open Q&A
- Re: com.dynatrace.builtin:service.errorcounthttp4xx not sending correct data
- Subscribe to RSS Feed
- Mark Topic as New
- Mark Topic as Read
- Pin this Topic for Current User
- Printer Friendly Page
- Mark as New
- Subscribe to RSS Feed
- Permalink
08 Sep 2017 03:35 PM
It appears that com.dynatrace.builtin:service.errorcounthttp4xx is not sending the correct data back:
  [ 1504794000000, 71 ],
  [ 1504794600000, 66 ],
  [ 1504795200000, 67 ],
  [ 1504795800000, 68 ],
  [ 1504796400000, 66 ],
  [ 1504797000000, 69 ],
  [ 1504797600000, 70 ],
  [ 1504798200000, 66 ],
  [ 1504798800000, 70 ],
  [ 1504799400000, 69 ],
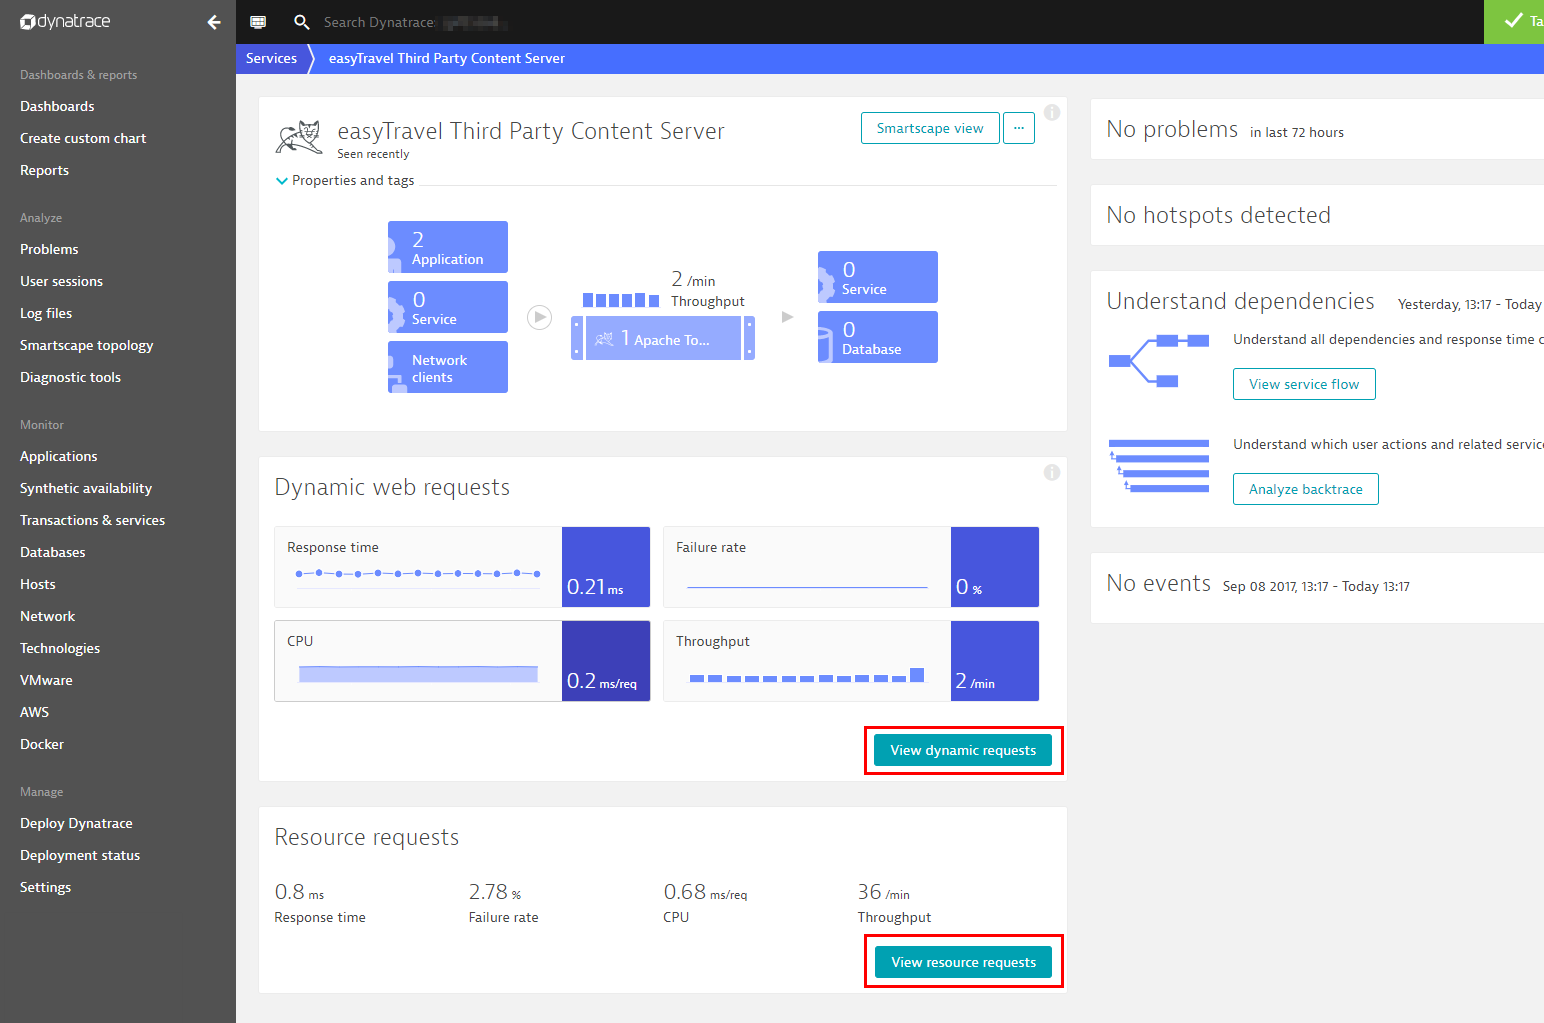
According to the data that is being sent back, it's recording between 60-71 4xx http errors even though the graph on dynatrace is telling a different story:

The graph is only showing 2 4xx http errors in the past day.
Can someone explain this?
Solved! Go to Solution.
- Labels:
-
services classic
- Mark as New
- Subscribe to RSS Feed
- Permalink
08 Sep 2017 09:23 PM
Hello Callum,
I would check the time parameters in the get request such as startTimestamp, endTimestamp and relativeTime to ensure that they are not including a timeframe that is larger than the one day timeframe you want.
Thanks,
David Nicholls
- Mark as New
- Subscribe to RSS Feed
- Permalink
11 Sep 2017 09:36 AM
The timeframe appears to be correct
- Mark as New
- Subscribe to RSS Feed
- Permalink
11 Sep 2017 11:12 AM
Could you please open a support ticket and share your service id and timeframe on that ticket so that we can check the details.
- Mark as New
- Subscribe to RSS Feed
- Permalink
11 Sep 2017 12:22 PM
@Callum B. one more idea why you might see different numbers - in the UI did you look for failed requests at the dynamic as well as resource requests?

- Mark as New
- Subscribe to RSS Feed
- Permalink
11 Sep 2017 01:02 PM
@Philipp K. Both dynamic and resource requests show similar readings
Featured Posts
