This website uses Cookies. Click Accept to agree to our website's cookie use as described in our Privacy Policy. Click Preferences to customize your cookie settings.
Real User Monitoring
User session monitoring, key user actions - everything RUM.
Turn on suggestions
Auto-suggest helps you quickly narrow down your search results by suggesting possible matches as you type.
- Community Home
- Platform
- Real User Monitoring
- Re: Dynatrace custom chart to display Frontend Time
Options
- Subscribe to RSS Feed
- Mark Topic as New
- Mark Topic as Read
- Pin this Topic for Current User
- Printer Friendly Page
Options
- Mark as New
- Subscribe to RSS Feed
- Permalink
23 Mar 2019 04:11 AM
We would like to show Frontend, network and Server time for an key user action in the dashboard, I am able to use custom chart to display network and server time, but unable to find metric for frontend time, Any help ?
Thanks
Solved! Go to Solution.
Labels:
Reply
8 REPLIES 8
Options
- Mark as New
- Subscribe to RSS Feed
- Permalink
23 Mar 2019 05:51 AM
Try user action duration 🙂
Sebastian
Regards, Sebastian
Options
- Mark as New
- Subscribe to RSS Feed
- Permalink
23 Mar 2019 10:31 AM
User Action duration does not represent frontend timing, user actions is more of a total of all (frontend + Network + Server ) time.
Options
- Mark as New
- Subscribe to RSS Feed
- Permalink
24 Mar 2019 10:10 AM
But you can compare it with server time. Actually measureing frontend time is not easy to evaluate. This is because it is not related only to front end performance but user device/computer as well. Charting this will not tell you if your front end is working well in general. This is why I’m building dashboards that are comparing server side performance and user action duration of the same portion of requests.
Sebastian
Regards, Sebastian
Options
- Mark as New
- Subscribe to RSS Feed
- Permalink
25 Mar 2019 02:56 AM
Hi Sebastian,
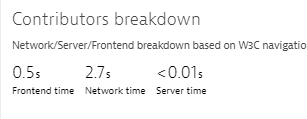
We would like to see below information in the dashboard, which is already shown when we drill down to load action screen, so I believe all the three values are captured in Dynatrace, I could see Network and Server time in custom metrics but not the Frontend time.
Regards
Peter
Reply
Options
- Mark as New
- Subscribe to RSS Feed
- Permalink
25 Mar 2019 06:50 AM
I know what you want, but even dom interactive measure will cover some requests time as well. Frontend time is result time counted user action duration - network - server. This is why there is no measure for this I think. But as I said this tells you something only in context of waterfall information (in my opinion).
Sebastian
Regards, Sebastian
Options
- Mark as New
- Subscribe to RSS Feed
- Permalink
20 Apr 2020 08:22 PM
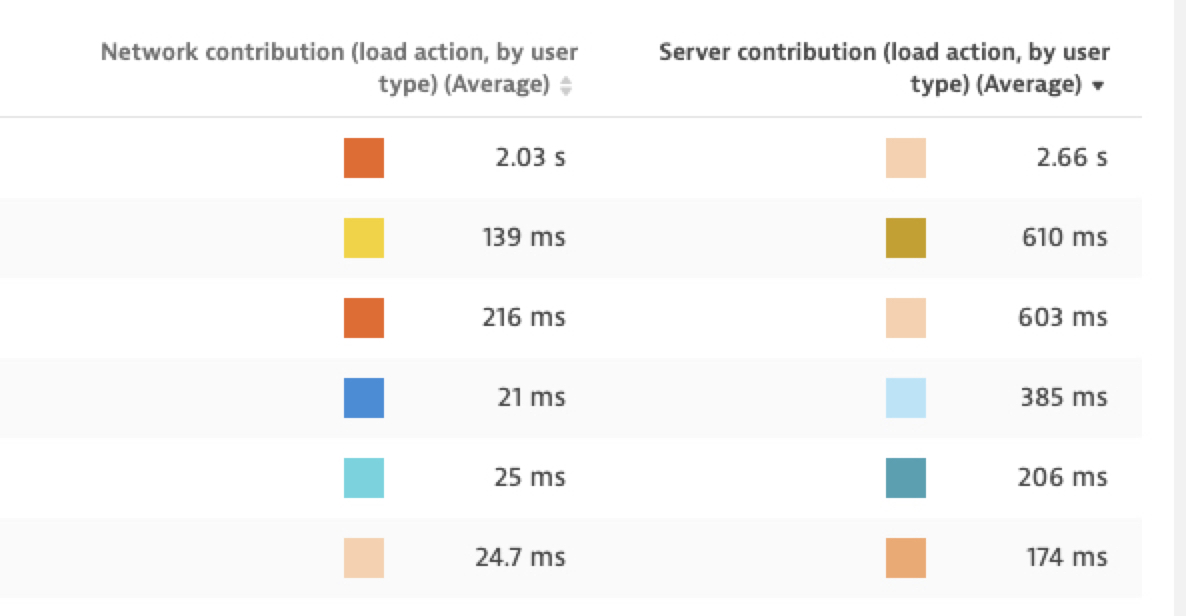
Hi @Sebastian K., @Peter S. I am also looking for charting frontend time(client time). Please let me know what is the metric need to select (if there is one) Please see the screenshot below, I am able to capture Network time, Server time, only thing missing here is Frontend time
Options
- Mark as New
- Subscribe to RSS Feed
- Permalink
22 Apr 2020 02:15 AM
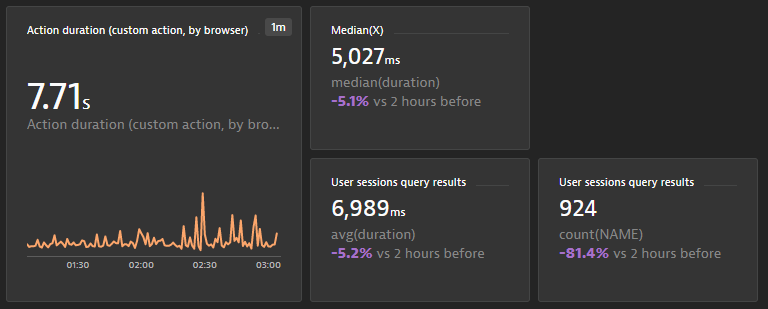
Do you try Usql + Custom chart ? you can choose what you need to chart "KPI" and take under control performance.
select avg(visuallyCompleteTime) FROM userACTION WHERE useraction.application =
to have Network, visually complete, and all other data.
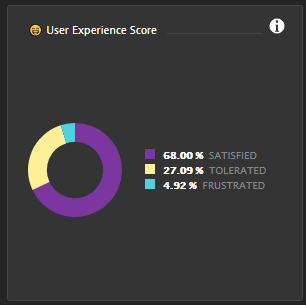
Best KPI for me is User Experience Score. that take under evaluation other factor (Range click, Bounce rate, user session, javascript error) .. You can have fast server but if the browser handle the customer go away and you must focus on Bad experience to improve overall customer satisfaction.
1 not apply customer spoke with other 10 potentially customer about his negative experience.
Reply
Options
- Mark as New
- Subscribe to RSS Feed
- Permalink
23 Apr 2020 04:51 PM
Thanks @Domenico B. This is very helpful as well.
Featured Posts
