This website uses Cookies. Click Accept to agree to our website's cookie use as described in our Privacy Policy. Click Preferences to customize your cookie settings.
Real User Monitoring
User session monitoring, key user actions - everything RUM.
Turn on suggestions
Auto-suggest helps you quickly narrow down your search results by suggesting possible matches as you type.
- Community Home
- Platform
- Real User Monitoring
- Re: How to evaluate client processing capacity?
Options
- Subscribe to RSS Feed
- Mark Topic as New
- Mark Topic as Read
- Pin this Topic for Current User
- Printer Friendly Page
Options
- Mark as New
- Subscribe to RSS Feed
- Permalink
14 Apr 2020
09:21 PM
- last edited on
30 Sep 2022
12:08 PM
by
![]() MaciejNeumann
MaciejNeumann
I have been experiencing for the last years an enormous impact of client side computing power on User Experience. That has obviously to do with an increasing amount of scripting and rendering.
How can we measure that capacity in Dynatrace? Speed Index and Visually Complete seem to reflect a little bit of it, but it would be great to have some sense of the client processing capabilities...
Any ideas?
Antonio Sousa
Solved! Go to Solution.
Labels:
Reply
8 REPLIES 8
Options
- Mark as New
- Subscribe to RSS Feed
- Permalink
15 Apr 2020 01:40 AM
Let's me say: Power is nothing without "internet" speed.
Final user market is moving faster on Mobile device like Phone and Tablet.
In my opinion Visually complete and User action duration are the best KPI.
- Visually complete take under control how much time the user need to wait to "make something".
- User action duration how much time the client need to download all component
Basically UX depend on the design of your application
More data you send to the device and more time the browser take for rendering on final device.
Think about your daily UX .. if you're a programmer for sure you have a powerful machine but when you navigate web page and page is blocked by rendering you live the site and go away in less then 3 second. Use Apdex to check the worst performance and think how to boost them in order to compress the performance distribution curve.
M.
Reply
Options
- Mark as New
- Subscribe to RSS Feed
- Permalink
15 Apr 2020 09:30 AM
Yes, the issue you make about the programmer having a powerful machine, and users not, is the real issue here.
I have seen a lot of web applications where the major factor impacting UX is a function of the computing power on the end-users machine. That is specially true for Single Page Applications.
But the question remains the same: how can we measure that capacity in Dynatrace?
Antonio Sousa
Options
- Mark as New
- Subscribe to RSS Feed
- Permalink
15 Apr 2020 11:52 AM
Hi Antonio
current market trend are "one page Application" loading amount of data at the beginning. (business workflow)
If your "thesis" is power machine load data more faster .......
then Visually complete is your way because give you information about how much time the machine take to "serve" to the customer a page ready to be used. (UX)
If you take a look to your data i think you will discover you have for example 10s (avg) for loading all component but user can use it after 3s.
To find worst performance you can use "percentile" and median to better understand the performance distribution.
M.
Reply
Options
- Mark as New
- Subscribe to RSS Feed
- Permalink
15 Apr 2020 08:24 PM
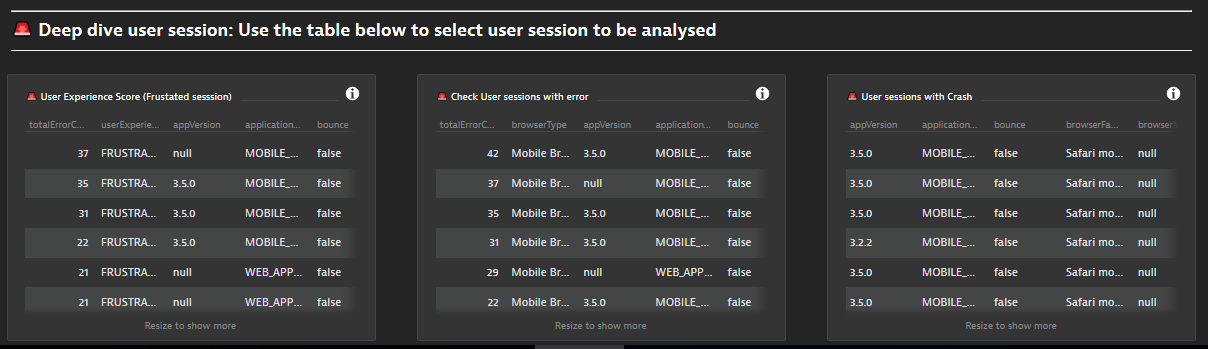
@Antonio S. We had a similar use case at my previous organization. While the apdex is nice and all it does not give you a drill down on requests and actions that are taking a considerable time. What we did was we looked at the User Sessions, more specifically the User Session Query Language that is now offered in Dynatrace. And we formulated a statement that would run and gather the User ID, of the Action/Transaction that fell within a time frame that we found to be "unsatisfactory" say over 2 seconds, and listed the main application that delivered this slow response/action. We get this chart/list as a tile and gave it to our web developers.
They loved it and it allowed them to jump right into the sessions and that transaction and dig deep into the root cause without having to ask the user when they had the issue and so on. Depending on the Size of your organization, It might be wise to build these statements so they filter off of Application Name. SO then developers can look at a singular app at a time rather then a bunch of issues across multiple apps.
-Chad
Reply
Options
- Mark as New
- Subscribe to RSS Feed
- Permalink
15 Apr 2020 08:33 PM
Further more we developed a dashboard for the mobile app team that listed the top issues for mobile app users. So say Bob is trying to make a loan payment but he keeps getting an error, and he is unaware that a email address is required for his E-Receipt he selected.
That transaction would then show up in that chart. Which we can then also build out another tile that looks at that single point of failure, the user not inputting in his email, and we can see across the infrastructure the amount of users that are having this problem. Maybe its not just Bob. Which would then allow developers to look and see how they can better resolve this issue, as in auto populate the email address, or give a pop up to the user that they forgot to supply it.
Our Customer Journey team loved this data! A real life example that I had was that users all of a sudden were paying their policy in full, a staggering number, So with these dashboard tiles we were able to compare that last week we had 12% of users paying in full, where this week 70% are paying in full. This allowed the Customer Journey Team and the Dev team to look into the recent changes on the webpage and found that the payment button was misleading as customers were use to making a monthly installment were now selecting a new button that looked almost identical but was a pay in full button. This realization pushed the dev team to roll back the change and rework the deign.
So many many use cases, and this was all done with the User Session SQL.
-Chad
Reply
Options
- Mark as New
- Subscribe to RSS Feed
- Permalink
15 Apr 2020 08:47 PM
We also needed to measure TLS capabilities and with Dyantrace we were able to compile the list of OS's and Browser versions and used that information to chart numbers and percentages of users, then going off default browser settings, we were able to list what version of TLS each browser had enabled by default. And we felt safe in saying that the average user wasnt going to further configure TLS Setting outside of the default. This gave management and dev teams the information needed as they looked to upgrade.
-Chad
Reply
Options
- Mark as New
- Subscribe to RSS Feed
- Permalink
15 Apr 2020 09:27 PM
Hi @Chad T. very interesting. I did the same for our mobile team on Hybrid app some months ago. .. error, user experience score and the list of bad case" base on error.
On mobile for sure is more easy becouse you have detail about mobile device and you can deep about battery level, disk space avalaibility, os version and device model.
In my understanding Antonio is looking for KPI in order to clusterize user/performance base on "machine power". Interesting "concept" even if i think power is nothing without clean code
Speaking about OnePage application in my experience there not a lot of way to do so. I'm currently dealing with OnePage "Worklow" that collecting data step by step and the only way to have real data (performance) is plitting the process creating business workflow base on placehold and/or naming rules
@Chad T. what do you think about ?
M.
Reply
Options
- Mark as New
- Subscribe to RSS Feed
- Permalink
15 Apr 2020 09:34 PM
Very Nice! Yeah that might be an issue for his particular use case. he could add in session properties and then use SQL off of that as well but nothing in dynatrace will report the cpu and ram on a device, unless it has the oneagent. And If an application did provide that I feel it might be a a privacy issue. But never the less an interesting use case.
-Chad
Reply
Featured Posts
