- Dynatrace Community
- Ask
- Real User Monitoring
- Re: Is load action phase 'redirect time' part of 'Network time'?
- Subscribe to RSS Feed
- Mark Topic as New
- Mark Topic as Read
- Pin this Topic for Current User
- Printer Friendly Page
- Mark as New
- Subscribe to RSS Feed
- Permalink
08 Aug 2018
01:46 PM
- last edited on
28 Apr 2021
09:12 AM
by
![]() MaciejNeumann
MaciejNeumann
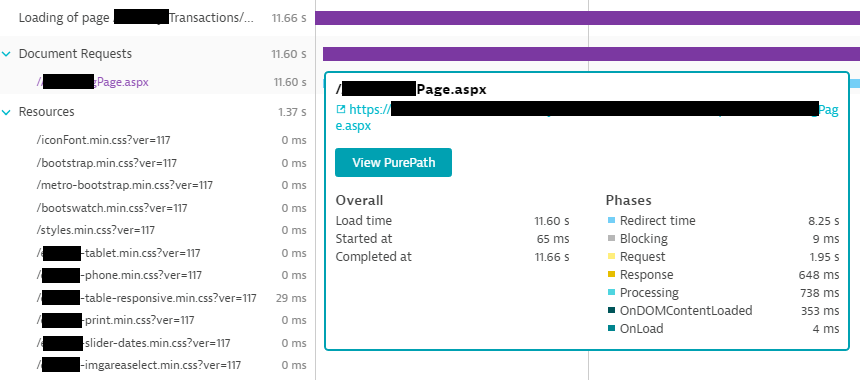
Certain page load actions always shows high 'Network time', with the W3C phases showing high 'Redirect time'.
- Does 'Network time' consist of 'Redirect time'? I found this thread, which explains 'Network consumption' but doesn't state where 'Redirect time' comes into play, assuming 'Network consumption' and 'Network time' is one and the same?
- Same as @Edmund Kueh's question, I'd also like to know if the network consumption formula below includes time to redirect, time to resolve the DNS and time to establish the TCP connection?
Network consumption: (requestStart - actionStart) + (responseEnd - responseStart)
Example: the page in question, is the home page of a client's financial system.
User would load the home page (https://secure.company.com), provide login credentials and log in. During this process, the user ID is checked and then the user's profile + financial dashboard is loaded - many services are involved in this process, all gathering data for the user's dashboard page, which is loaded after a period of time (https://secure.company.com/landingpage.aspx).
There is no extra info on the redirect time and they're asking if the redirect time includes the total time from login until the user's dashboard page is loaded? If so, would we see the authentication as a separate PurePath and the loading of the user's financial data, as a separate PurePath?
I've attached example screenshots, in case it'll help.
PS: the screenshots were provided by the client; unfortunately, they are not from the same page load, but it does show the items in question and how much time is spent on redirect, out of total time.


Solved! Go to Solution.
- Mark as New
- Subscribe to RSS Feed
- Permalink
10 Aug 2018 12:11 PM
yes, the network time includes the redirect time and the formula from above is correct:
Network consumption: requestStart + (responseEnd - responseStart)
where we take the W3C nav-timing timestamps

- Mark as New
- Subscribe to RSS Feed
- Permalink
13 Aug 2018 11:03 AM
Thanks @Clemens F. for confirming redirect forms part of network time.
Can you perhaps help explain why the redirect time is that long in their case though? Am I correct in saying that it considers the time it takes from the 1st URL that is accesses, until the 2nd URL is loaded, as per my example/explanation in my original post?
- Mark as New
- Subscribe to RSS Feed
- Permalink
13 Aug 2018 12:13 PM
It's hard to tell where the long redirect time is coming from, without knowing the system but it sounds plausible as you explained it.
br,
Clemens
- Mark as New
- Subscribe to RSS Feed
- Permalink
14 Aug 2018 01:09 PM
Is there any way to further analyse redirect time? Client consistently sees high network time, mainly caused by redirect time and they want to understand where the time is spent, exactly. I don't know if this would be possible in Dynatrace?
- Mark as New
- Subscribe to RSS Feed
- Permalink
17 Aug 2018 06:39 AM
If I could access their data I could give it a try to analyze.
- Mark as New
- Subscribe to RSS Feed
- Permalink
23 Aug 2018 08:54 AM
Thanks Clemens, that's very kind of you. Let me check with the client if they have any objections to your offer and I'll let you know, then we can perhaps set up a quick WebEx.
- Mark as New
- Subscribe to RSS Feed
- Permalink
19 Sep 2018 12:12 PM - edited 29 Mar 2022 10:48 AM
For those who come across this thread and face a similar situation: the WebEx to investigate this further, never took place. However, we did get to the bottom of the 'issue', after someone at the client, who understands their application better than I will ever do, had a look at it too.
The 1st request i.e. loading of the user's portal page after clicking on the login button, shows the high redirect time. However, there is a 2nd request, which handles gathering of the info to be displayed on the portal. This 2nd request is seen as a separate request and is not tied up with the one showing the high redirect time. When we compared the redirect time with the 2nd request's time, they match.
What is not clear and might require further investigation, is why these two requests are not combined under the original user action but seen as completely separate requests (thus separate user actions / PurePaths) and why the 2nd is seen as 'redirect' time on the 1st. Perhaps there is a need for better configuration in Dynatrace, or is this handled as designed?
Featured Posts
