This website uses Cookies. Click Accept to agree to our website's cookie use as described in our Privacy Policy. Click Preferences to customize your cookie settings.
Real User Monitoring
User session monitoring, key user actions - everything RUM.
Turn on suggestions
Auto-suggest helps you quickly narrow down your search results by suggesting possible matches as you type.
- Community Home
- Platform
- Real User Monitoring
- RUM Waterfall- Request Time always high
Options
- Subscribe to RSS Feed
- Mark Topic as New
- Mark Topic as Read
- Pin this Topic for Current User
- Printer Friendly Page
Options
- Mark as New
- Subscribe to RSS Feed
- Permalink
17 Sep 2021
11:38 PM
- last edited on
18 Nov 2021
12:15 PM
by
![]() MaciejNeumann
MaciejNeumann
In our RUM data , i always see "Request Time" to be always on a very high side , sometime as high as few 3-4sec+ , as compare the "response time" or other metrics
What could be the reasons of high "request times" , & any general recommendations to improve it?
see attach screenshot pls
We are in AWS West & all our users are from US only
Solved! Go to Solution.
Labels:
HighRequestTime.jpg
233 KB
5 REPLIES 5
Options
- Mark as New
- Subscribe to RSS Feed
- Permalink
17 Sep 2021 11:46 PM - edited 20 Sep 2021 08:12 PM
One more thing. We do have SSO in the mix which is running MS Azure
Options
- Mark as New
- Subscribe to RSS Feed
- Permalink
18 Sep 2021 08:20 PM
Can you post a screenshot of the waterfall?
Antonio Sousa
Options
- Mark as New
- Subscribe to RSS Feed
- Permalink
20 Sep 2021 05:25 PM
Already did in my orignal post
Options
- Mark as New
- Subscribe to RSS Feed
- Permalink
20 Sep 2021 07:09 PM
attached
HighRequestTime.jpg
233 KB
Options
- Mark as New
- Subscribe to RSS Feed
- Permalink
20 Sep 2021 08:04 PM
Sorry, I didn't get the attachment, as I normally expect an inline image 🙂
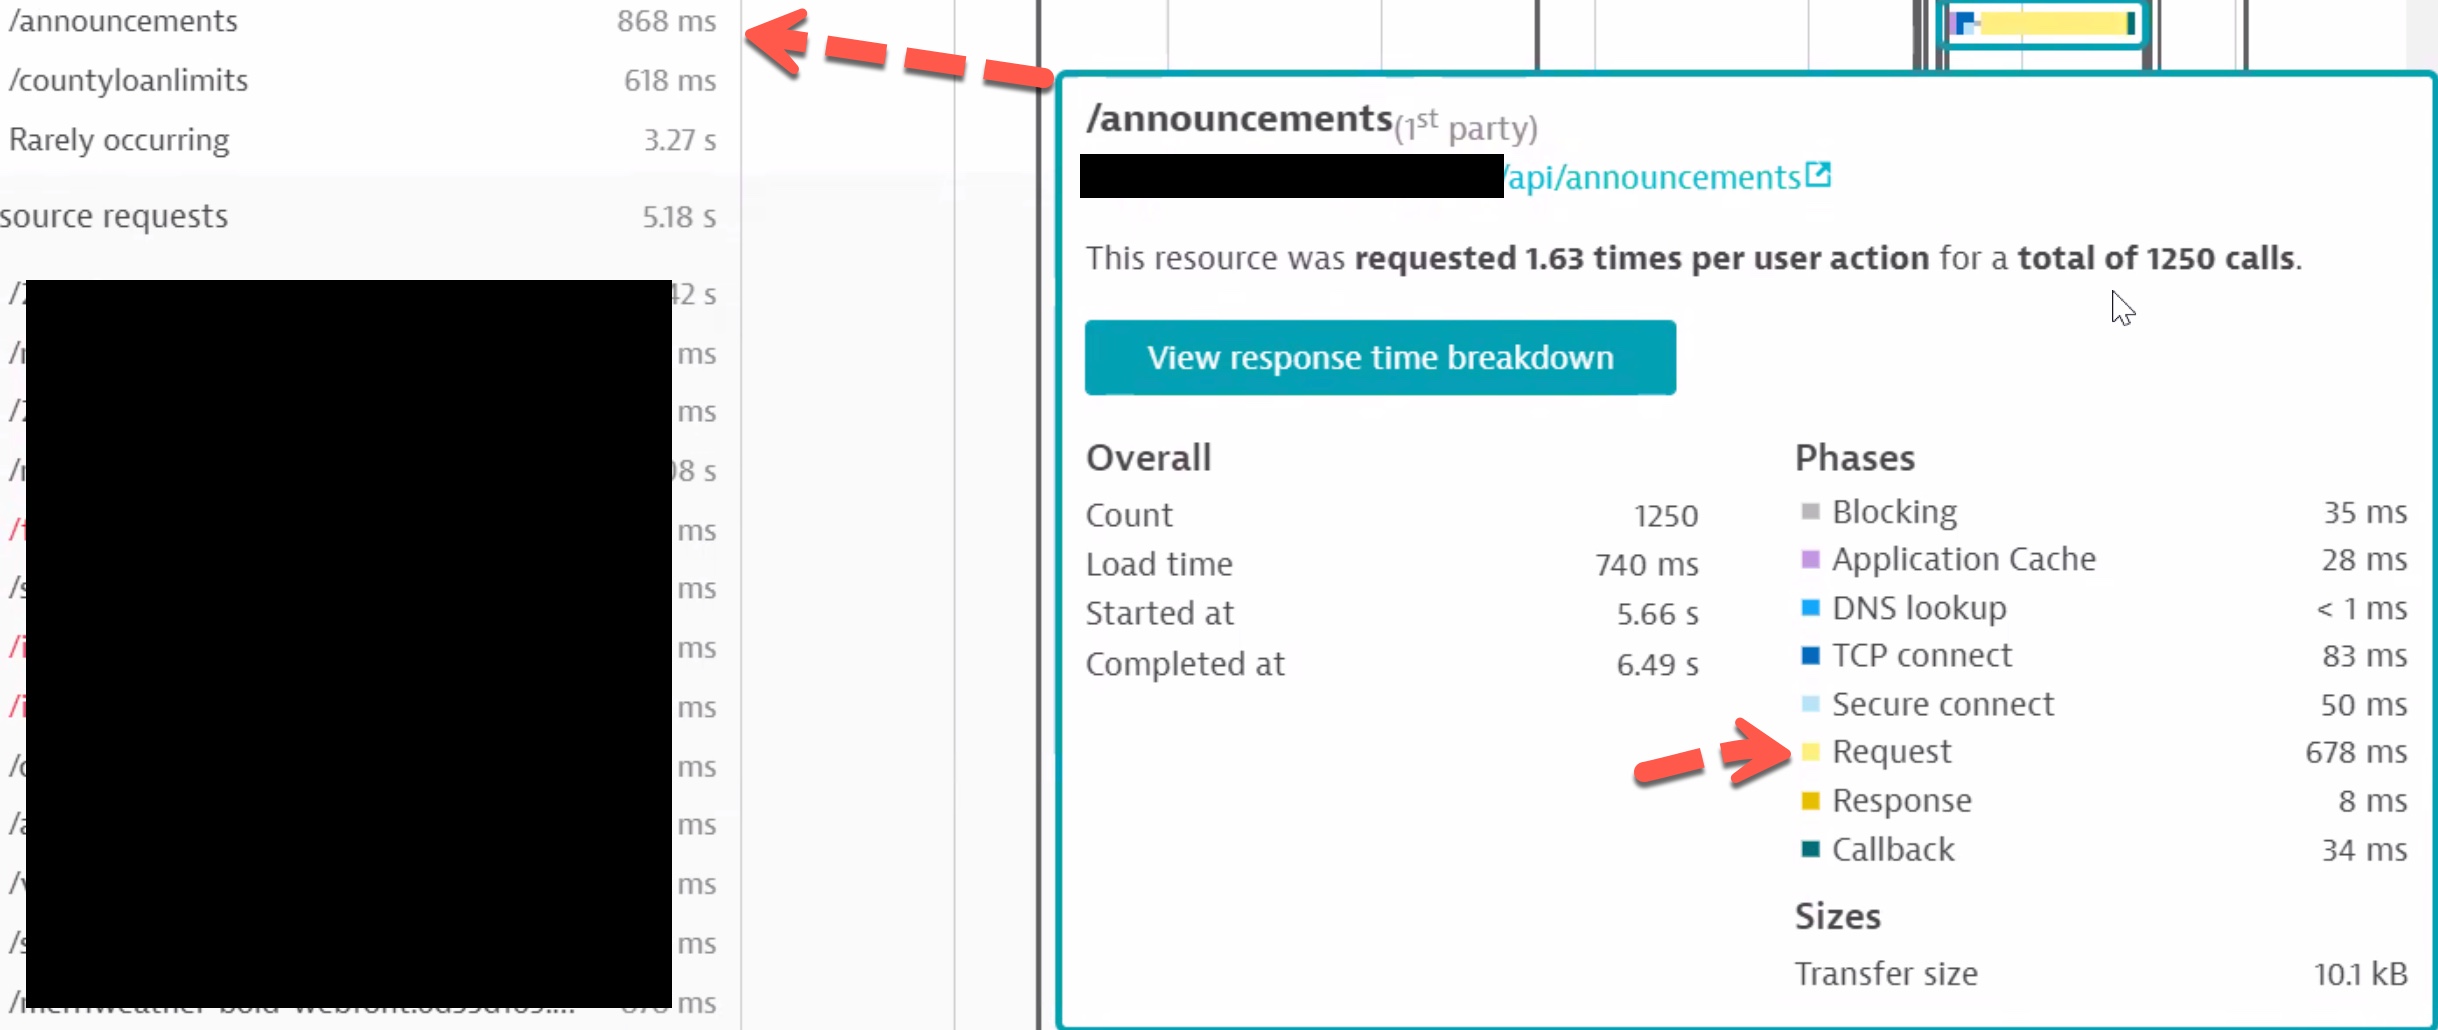
From the attachment, and this is what we see in a lot of cases, I believe what is happening is the following:
- There is a TCP/443 secure connection that is being established, and that took in this case 83 ms. This is the time to be expected for the 1 RTT for the TCP connection and 3 RTT for the secure TLS connection.
- You've got blocking & application cache times on the client side too
- There's also callback time from the client side.
- You've got 678 ms for the request, but on the server side it should have taken about 20 ms less. Doesn't seem you have Purepaths for those requests though.
To improve, I would try to find out why a secure connection is happening in this case? Depending on the connectivity, this is something that even much worse than what is shown in the waterfall.
I would also look at how this is being invoked, as blocking and application cache times are things related to browser behaviour, and how it deals with several types of page construction. Callback time is also related to how these XHRs are being invoked.
Antonio Sousa
Featured Posts
