- Dynatrace Community
- Ask
- Real User Monitoring
- Re: Service flow timings and Percentages breakdown are not matching. Please clarify
- Subscribe to RSS Feed
- Mark Topic as New
- Mark Topic as Read
- Pin this Topic for Current User
- Printer Friendly Page
- Mark as New
- Subscribe to RSS Feed
- Permalink
04 Dec 2020 02:25 AM
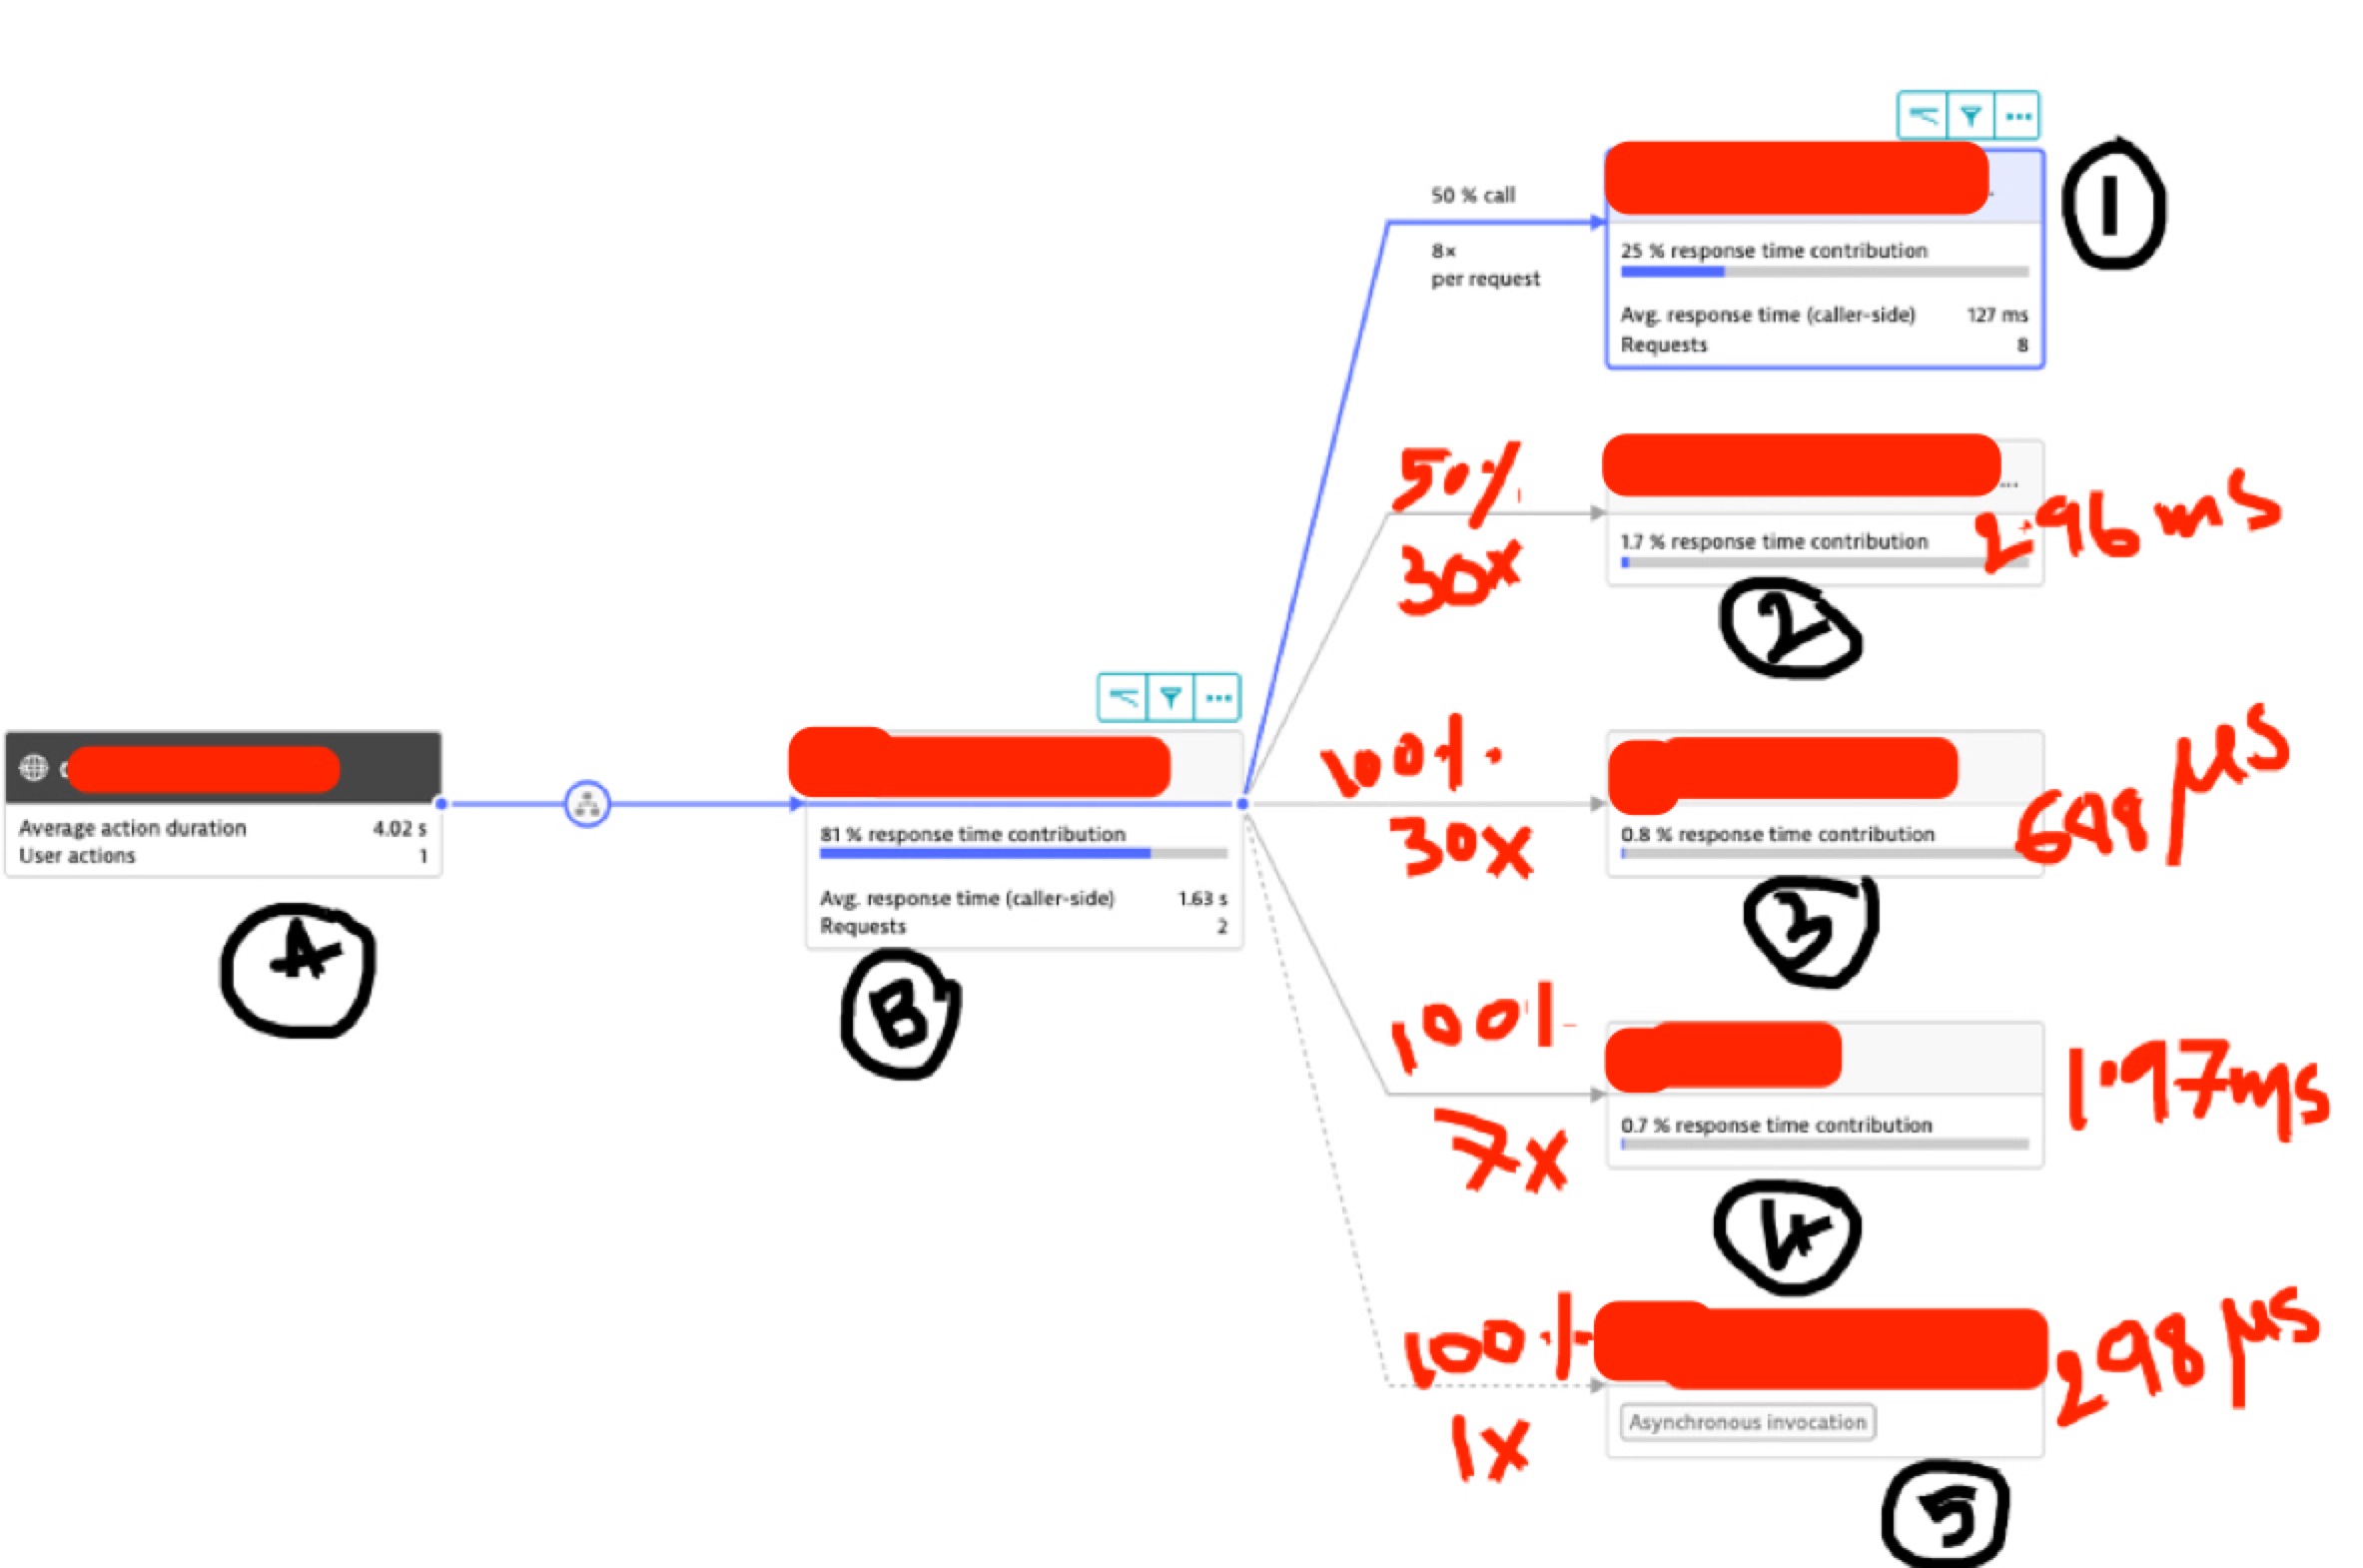
 Hi, please see the screenshot attached. I am trying to calculate the response times breakdown on each tier and the percentage of contribution manually for better understanding. Please help me with what I am missing here.
A --> User Action duration is 4.02 seconds (If my understanding is not accurate, please help me on how to add these numbers together to get approx. 4.02 sec?)
B (2 requests, Avg. response time 1.63 sec)--> 81% (3.2 seconds) is the contribution where as remaining 19% is on DOM, TCP connection, etc. (network related)
1 --> 50% of calls ( 8x per request) , Avg. response time per request is 127 ms => 1 x 8 x 127ms = 0.1016 sec (approx..) Question here is Dynatrace shows this tier as 25% of response time contribution. 0.1016 sec is not 25% of 81%. If 25% represents percentage of calls distribution how to explain remaining 75% ?
2 --> 50% of calls ( 30x per request), Avg. response time per request is 2.96 ms. Same question as above. Number doesn’t match with 1.7%.
3 --> 100% of calls ( 7x per request), Avg. response time per request is 688 microsec. 0.8% doesn’t match
4 --> 100% of calls ( 7x per request), Avg. response time per request is 1.97 ms. 0.7% doesn’t match
5 --> 100% of calls ( 1x per request), Avg. response time per request is 298 microsec. % not shown by Dynatrace here.
Appreciate your help!
Solved! Go to Solution.
- Mark as New
- Subscribe to RSS Feed
- Permalink
10 Dec 2020 07:45 PM
I was able to find some info from Dynatrace support about Service flow % and RT calculation. I will update here when I have complete details.
DT Support:
In general, the service flow is calculated on the timing on each individual call, therefore the provided formula in general is correct BUT only for 1 level.The second, third etc. level needs to consider ratios from the parent level.This makes the more complex then the 1 level formula.
For the second tier, etc.. a modified formula can be used. New formula is: ServiceRT * Call-Share-Of Service* Call-Per-Request-Of Service / (Call-Per-Request-Of Root * Root RT)
A couple of things to clarify is that:
- Actually, we calculate on each call so the exact data is not based on average values, we operate on each call.
- The above formula is a close estimation: In general, we sum up all nodes of each call and divide it through the overall sum.
- Mark as New
- Subscribe to RSS Feed
- Permalink
11 Jan 2021 11:16 AM
Hello @Suresh K.
The Contributor breakdown chart gives you a quick overview of time spent on the frontend, the network, and the server.
I believe this is a fast and quickest approach to analyze user actions.
Regards,
Babar
- Mark as New
- Subscribe to RSS Feed
- Permalink
12 Jan 2021 12:04 AM
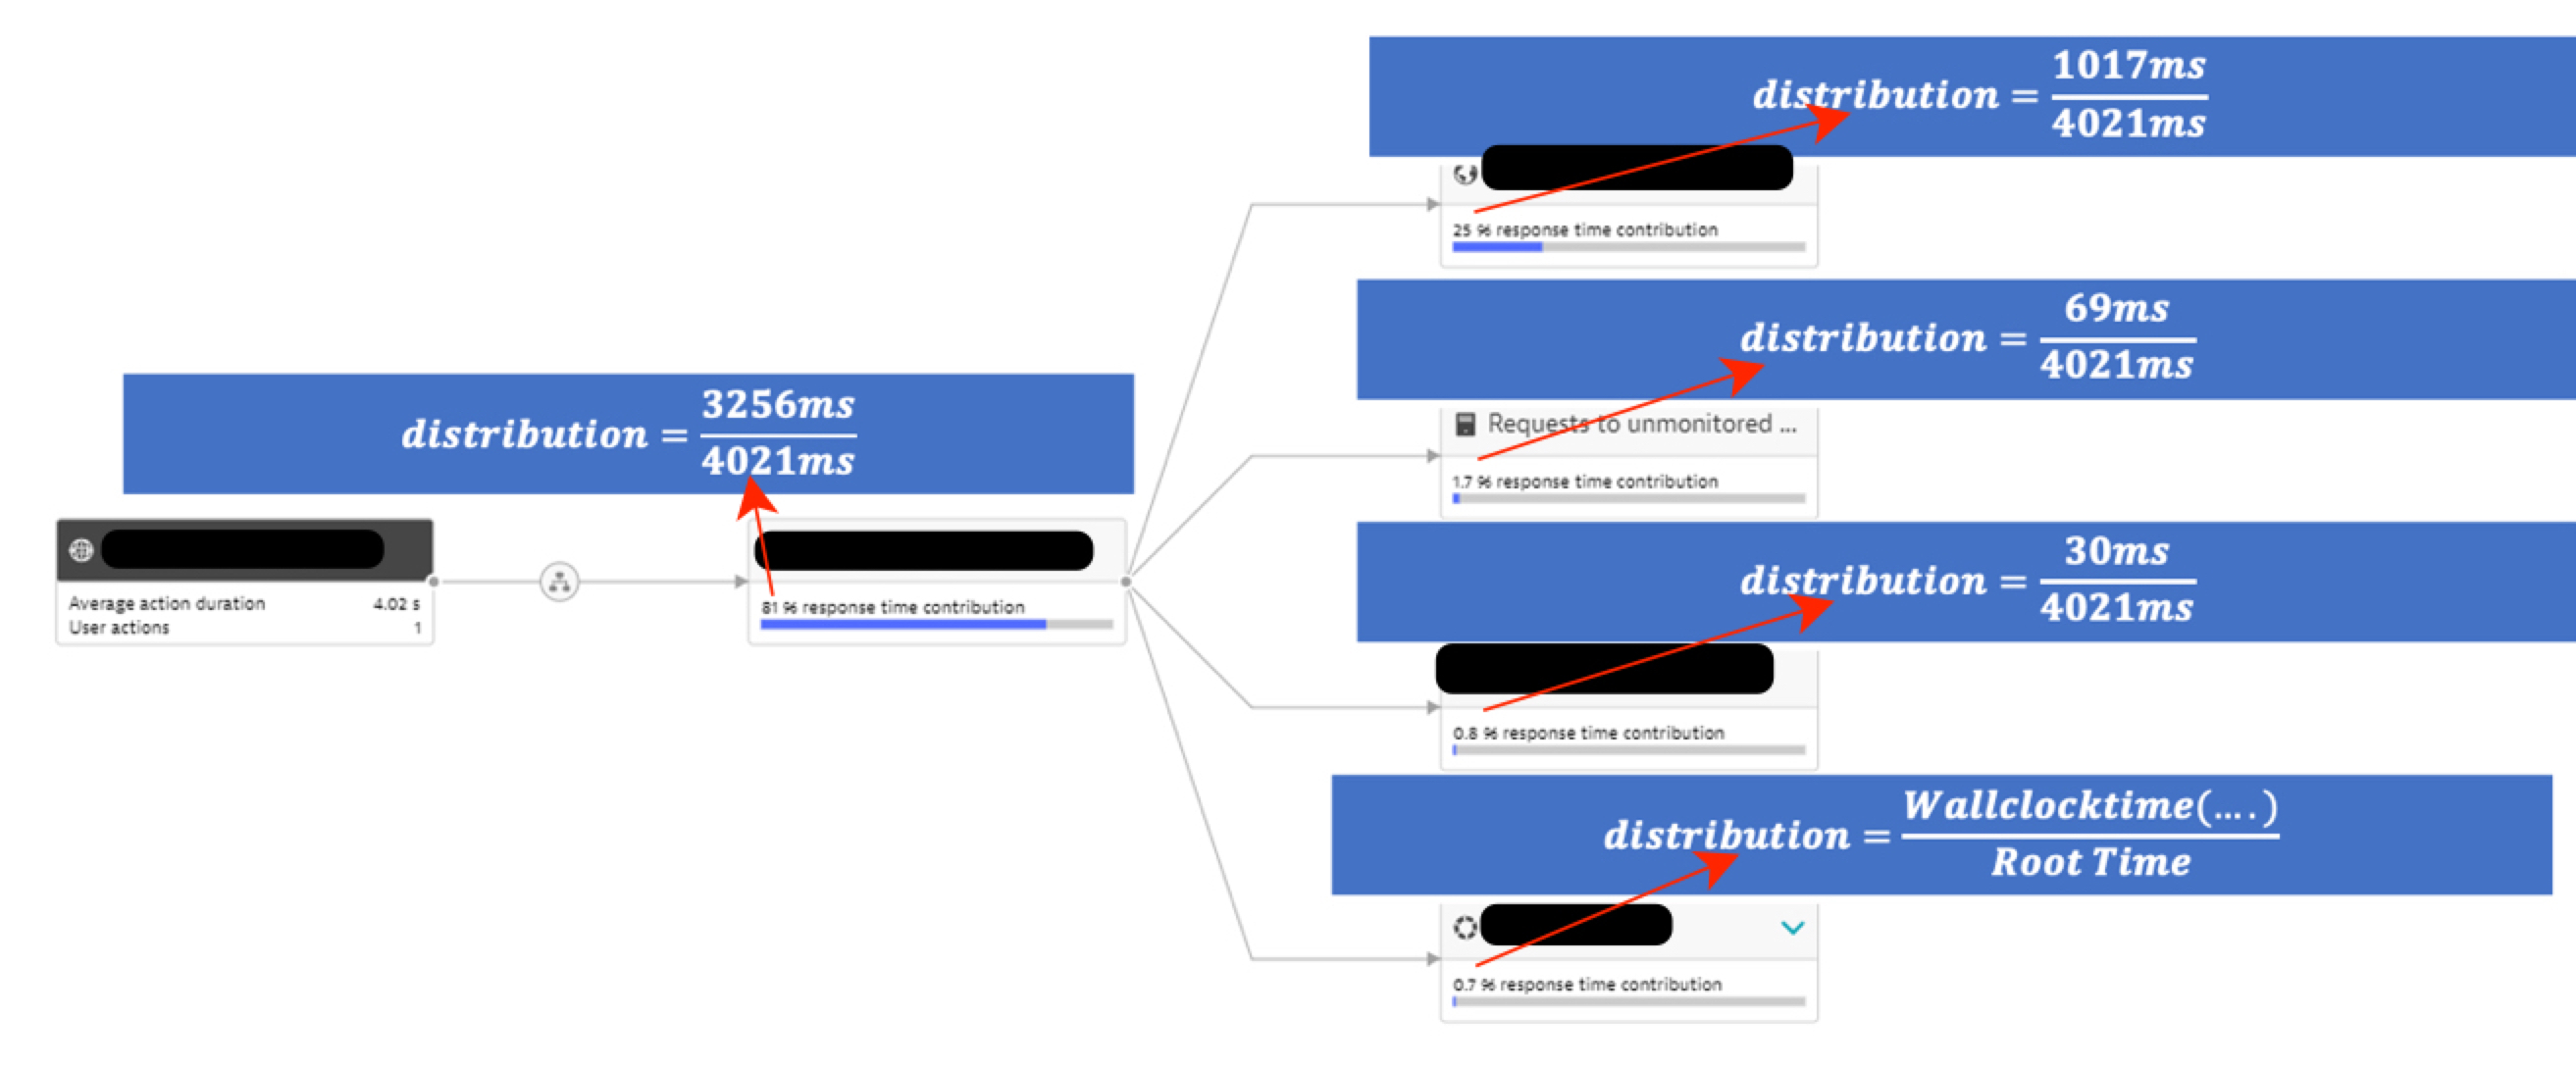
Thanks @Babar Q. I was able to get the following info. 'x%' Response time contribution that shown on any service/tier on Service flow diagram is the % contribution of Root time (User action duration)
Below is an example of a user action (Avg. User action duration 4.021 sec.) Hope this helps. Thanks, Suresh

Featured Posts
