This website uses Cookies. Click Accept to agree to our website's cookie use as described in our Privacy Policy. Click Preferences to customize your cookie settings.
Real User Monitoring
User session monitoring, key user actions - everything RUM.
Turn on suggestions
Auto-suggest helps you quickly narrow down your search results by suggesting possible matches as you type.
- Community Home
- Platform
- Real User Monitoring
- Re: User action faillure (error) rate
Options
- Subscribe to RSS Feed
- Mark Topic as New
- Mark Topic as Read
- Pin this Topic for Current User
- Printer Friendly Page
Options
- Mark as New
- Subscribe to RSS Feed
- Permalink
16 Nov 2020 03:51 PM
Hello,
How can I make a tile (or dashboard) to count or to view the error rate for the user actions
Note : the application is Mobile app!
Thanks
Sharing Knowledge
Solved! Go to Solution.
Labels:
- Labels:
-
mobile monitoring
-
user actions
6 REPLIES 6
Options
- Mark as New
- Subscribe to RSS Feed
- Permalink
17 Nov 2020 06:08 PM
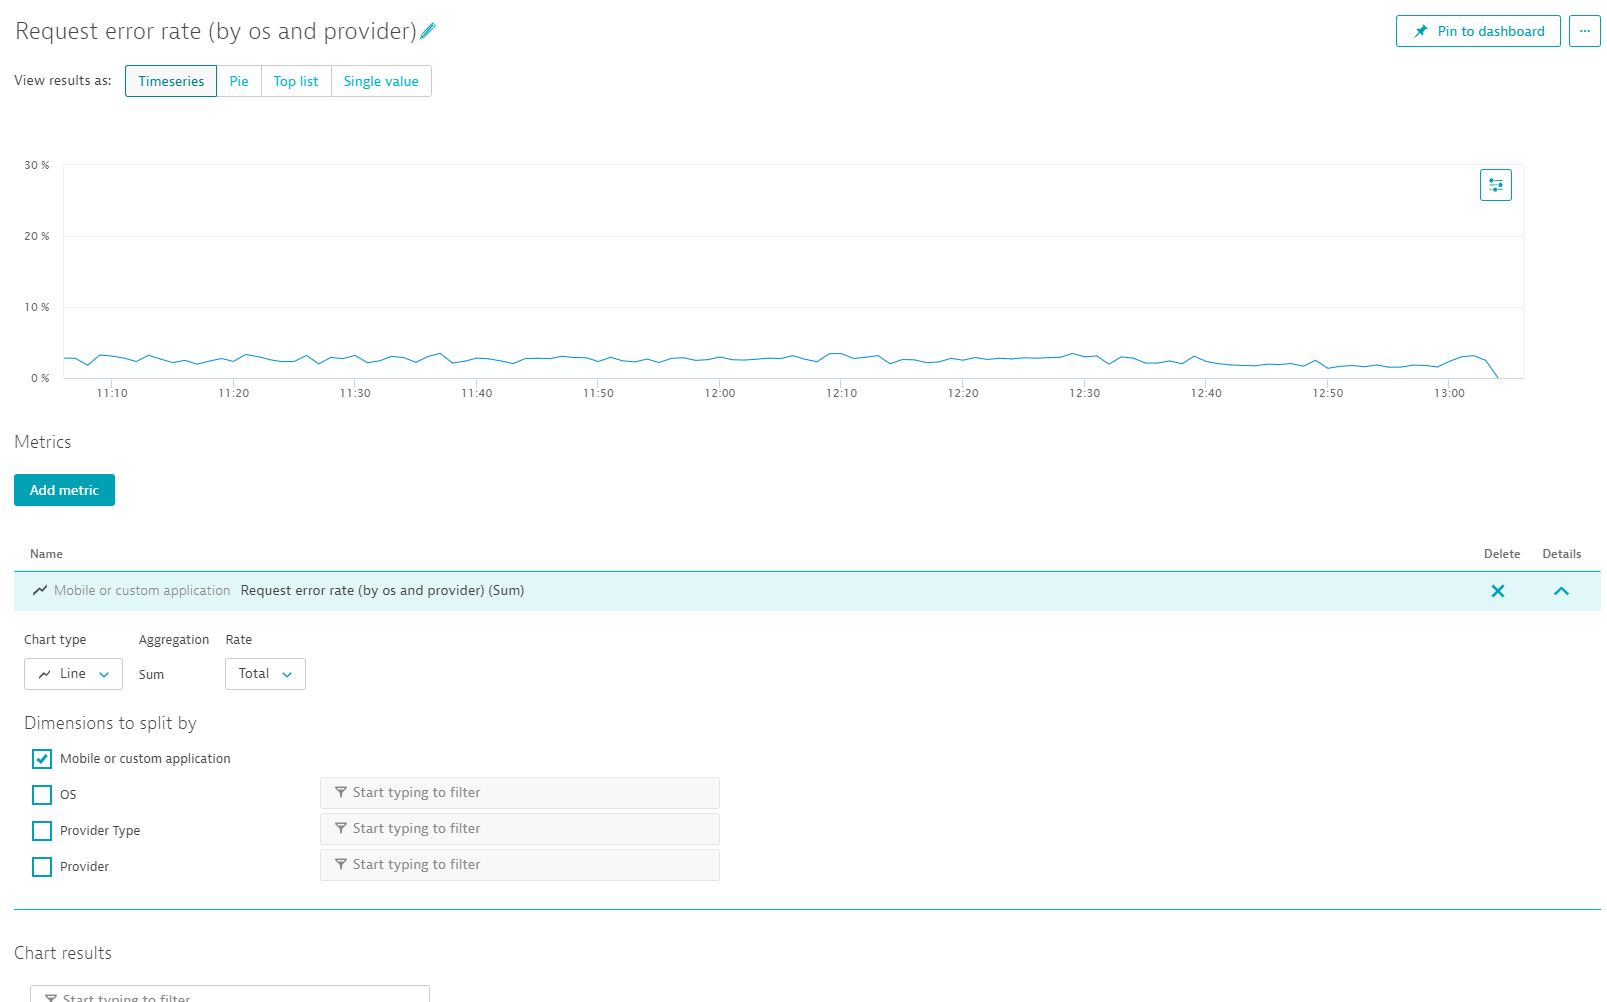
You can do this via the create custom chart and search for error and then select mobile application. This will also allow you to select out the mobile apps as desired.
-Chad
Options
- Mark as New
- Subscribe to RSS Feed
- Permalink
18 Nov 2020 08:58 AM
Hi @Chad T.
Thanks for your comment,
Yes, I explore this option but the result is not satisfying : I cannot find any metric for request rate that allow me to split by user action, request ...
Sharing Knowledge
Options
- Mark as New
- Subscribe to RSS Feed
- Permalink
18 Nov 2020 07:53 AM
There's no rate for User Actions with errors. I will put this on the backlog and maybe we will add it.
In addition to the request rate, there's there are several options:
- create a Custom Metric via the MDA in the mobile application
- create a chart that shows the User Action count and the error count at the same time
- USQL
- Access data via API and chart in a custom tool
My answer is not very specific. Please let me know which options sound good for you and maybe even a bit more background on what you a looking for and I will follow-up with more detailed information.
Options
- Mark as New
- Subscribe to RSS Feed
- Permalink
18 Nov 2020 09:03 AM
Hi @Thomas B.
1- Do you have the exact way to create the custom metric for that ?
2- Create a chart that shows the User Action count and the error count at the same time : no split by request, action ...
3- I explore this option, but the customer insist on the rate :'(
4- Example ?
Sharing Knowledge
Options
- Mark as New
- Subscribe to RSS Feed
- Permalink
20 Nov 2020 12:57 PM
Regarding the options that I've listed above, most of them will require you to do the actual charting outside of Dynatrace.
But we have an upcoming feature, that will be released early next year: SLI and SLO.
This will allow you to create an SLI for 'healthy' User Actions, by comparing the count for the Custom Metric that you create for 'healthy' User Actions against the total count of User Actions for your app.
Once the SLI has been created, it will have an error budget and warning state and it can be added to a dashboard.
This is probably what you are looking for
a note: it's not totally straightforward, since the Custom Metric that can be created via the MDA (see below), will measure duration and here the count is needed. This can be achieved by appending `:(count)` to the key of the metric when defining the SLI.
on creating a Custom Metric:
The way to go is to create a custom metric for "healthy" User Actions. i.e. in the MDA you need to filter for user actions that have no error and press "Create Metric".
That provides you with a metric for the total count and a metric for the "healthy" count.
To chart that in an external tool, you can access these metrics via API (in the upper right corner press on the user icon look for "Environment API v2" in the menu that opens; on that API documentation page look for "Metrics").
Options
- Mark as New
- Subscribe to RSS Feed
- Permalink
10 Mar 2021 12:18 PM
Hey! In the meantime, we have released a new feature 'SLO' which allows you to compare two metrics to calculate a success rate.
With this you could e.g. use the Apdex to measure total number of user actions against the number of frustrated user actions.

Featured Posts
