- Dynatrace Community
- Ask
- Synthetic Monitoring
- Re: Can I use DynaTrace to monitor calls to my APIs?
- Subscribe to RSS Feed
- Mark Topic as New
- Mark Topic as Read
- Pin this Topic for Current User
- Printer Friendly Page
- Mark as New
- Subscribe to RSS Feed
- Permalink
03 Mar 2023
03:47 PM
- last edited on
28 Mar 2023
12:24 PM
by
![]() MaciejNeumann
MaciejNeumann
I am very new to DynaTrace. I was under the impression I could use the tool to monitor calls to the many API endpoints my company supports. For example, I'd like to see data on calls to:
https://MyCompany.com/ProxyService/search/advanced
I'm following the guidelines on this help page: https://www.dynatrace.com/support/help/platform-modules/digital-experience/synthetic-monitoring/http.... For some reason, DynaTrace calls these 'synthetic monitors.'
I choose the "Create http monitor" option and fill in the details (HTTP POST, fill in the URL). The next thing I'm presented with is a very confusing "Frequency and locations" screen. I must have a fundamental misunderstanding of what I'm creating. I simply want to monitor all calls to my API. I don't care and/or see why I should be selecting "synthetic locations". If anything, I would expect a monitor to be telling ME the location of a caller (an IP address, for example)
Perhaps I just don't understand what it is in DynaTrace that I really need to set up. What I am after is sort of a honeycomb grid comprised of a list of API endpoints that I could take a quick look at by status (200, 403, 500, etc.) I just want to list the endpoints and let DynaTrace return whatever data it can for me. This whole "synthetic location" thing seems like a red herring that really isn't relevant to my problem.
Thanks in advance for any help you can provide to this newbie.
Solved! Go to Solution.
- Mark as New
- Subscribe to RSS Feed
- Permalink
03 Mar 2023 04:17 PM
Hello @MarkAaron in first place you need to setup OneAgent on your Frontend Servers at least. Then you can go to services, and then search for your service, there you have several filter options and you can see the Distributed Traces for your services, you can made up a lot of things inside this great tool called Dynatrace. I suggest you to see the videos on the Dynatrace University.
- Mark as New
- Subscribe to RSS Feed
- Permalink
03 Mar 2023
06:28 PM
- last edited on
28 Mar 2023
12:24 PM
by
![]() MaciejNeumann
MaciejNeumann
Hi Daniel,
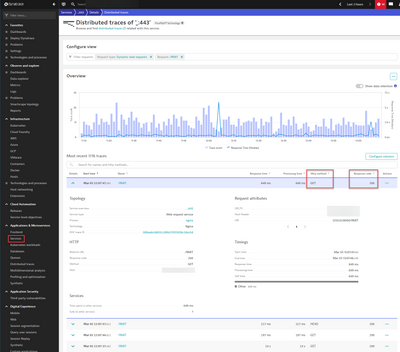
Thank you so much for your kind reply. Your screenshot was a great help. It appears that we do have OneAgent installed; I am able to go to Applications & Microservices, then Services, then see either Top Web requests or Distributed Traces. I get a display identical to yours.
What I am missing, and what my team is asking for, is a way to monitor a SPECIFIC set of apis (RESTful services), as identified by endpoint URLS. For example, https://MyCompany.com/proxy/api/search, https://Mycompany.com/proxy/api/showuser, etc. We have a large group of these API endpoints we would like to monitor, perhaps in a honeycomb graph. For our purposes, we care about displaying these endpoints, and these endpoints only.
The very nice explanation you gave me did lead me to a display of services, but it's a list of 192 services that don't include any of the endpoints we are interested in monitoring. Just browsing through the list, it looks like it's showing me a list of apps registered specifically with IIS (as WCF services, etc.) I don't see a way to tell DynaTrace "watch and report on these specific URLs". Is such a thing even possible?
- Mark as New
- Subscribe to RSS Feed
- Permalink
03 Mar 2023 06:58 PM - edited 03 Mar 2023 06:59 PM
Ok, to send your services to the Dashboard (Honeycomb) you need to filter the ones you need.
ie: Filter by Web Service, Technology or other, once you find them you can use the Pin to dashboard button.
- Mark as New
- Subscribe to RSS Feed
- Permalink
03 Mar 2023 07:12 PM
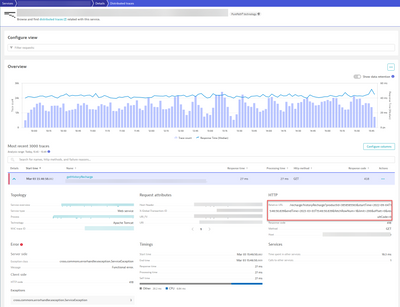
Once you find your service you can filter for the URL host:
and under relative URL /search /showuser should be there:
- Mark as New
- Subscribe to RSS Feed
- Permalink
03 Mar 2023 07:58 PM
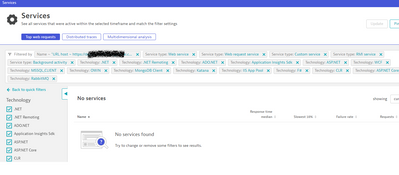
Thanks again so much for your help Daniel. This got me closer I think, but I am beginning to think maybe Dynatrace doesn't do what I want to do. I wasn't able to find my api using the URL host filter (1st screen snapshot). I went back and tried toggling every available option and running the query again, but no joy (1st snapshot).
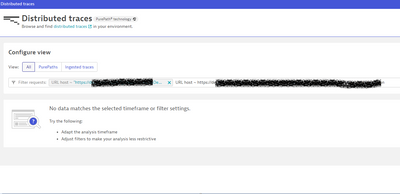
Even if this worked for this one URL, what we're looking to do is set up a monitor that watches several dozen api endpoints. The screen you had me try only seems to offer one URL filter. I went over to "distributed traces" (second screen snapshot) and it looked at first like I could do multiple URLs there, but, no joy--only the first URL I enter gets converted into a tag... the second one just kind of hangs out there like unrecognized text.
So I'm not sure where to look from here. With your kind help I thought I was in the ballpark--if I had to, I could have lived with typing in a couple dozen filters. But, I'm not getting any data back on even ONE filter (I know the endpoint is being hit, I'm triggering it via Postman and watching the results come back). And I'm stumped as to how I might filter to include dozens of endpoints.
- Mark as New
- Subscribe to RSS Feed
- Permalink
03 Mar 2023 07:57 PM
Try the Multidimensional analysis to watch the calls to your APIs, since you already have the OneAgent deployed and monitoring your APIs technologies.
https://www.dynatrace.com/support/help/shortlink/multidimensional-analysis
Using the MDA to find your APIs requests, you can see which Service is hosting these requests, set them as Key Request and then creating a chart based on the metrics you need for those.
- Mark as New
- Subscribe to RSS Feed
- Permalink
06 Mar 2023 04:25 PM
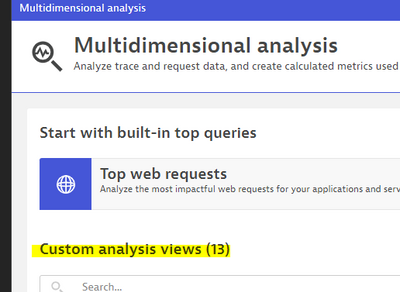
Thank you dannemca, this brought me very close to what I am trying to do. MDA did indeed bring up a list of service app pools hosting those requests, so this is progress. The sad thing is that when I found a service I wanted, there was no way from the API to add them in a group to my dashboard. I was looking into the key request feature you mentioned, and then something strange happened. All of a sudden, when I go into the MDA page, I no longer see a list of services. Instead, I see a list of "custom analysis views". I can't get rid of this list. I'd like to get back to what I saw originally when I discovered MDA--a list of all my services. Any idea what's going on here?
- Mark as New
- Subscribe to RSS Feed
- Permalink
06 Mar 2023 05:02 PM
Mark, what kind of data do you want to pin to a dashboard? If you are looking for request calls , for example, you can first, set a request as a key request, and then use the metric "builtin:service.keyRequest.count.total" in Data Explorer and play with the filters. https://www.dynatrace.com/support/help/observe-and-explore/explorer
For MDA, that's the default page for MDA indeed. If you want to create a new one, you should click on the Create Analysis View, play with metric and filter and once done, you can save this view for future. It will then appear in this same list next time.
- Mark as New
- Subscribe to RSS Feed
- Permalink
06 Mar 2023 06:37 PM
Hi dannemca, thanks so much for the reply. Maybe it is my faulty memory, but it seemed like the first time I visited MDA, it showed me ALL of my ASP.NET and .NET Core app pools. I could very well be in error here--this could be wishful thinking. All I'm seeing right now is TOP requests.
What I'm really after is, we have a set of environments (DEV, TEST, RC, LIVE, etc.). Within each of those environments, we provide the same set of services (with differently URL prefixes, of course). I'd like to have a set of dashboard tiles for each environment so I could tell at a glance if a "service" (an app pool, in this case, seems as close as we can get) is experiencing problems, then I could drill down into it and see which endpoint is returning the error(s).
Your MDA recommendation seems like a very good starting point because it appears to be listing the IIS app pools as "services", and I can indeed see some of our endpoint URLs when I drill down into one.
I will next look at key requests and educate myself there. Again, thanks for your input. I know that responding to newbie questions can be a bit tiresome. Your help is really appreciated. Dynatrace looks like a great tool, there is just a lot to learn!
- Mark as New
- Subscribe to RSS Feed
- Permalink
06 Mar 2023 08:06 PM
That's the purpose of this community, help and be helped!! Everyone is newbie in some subject!!!
Consider to use tags/metadatas / hostgroup to split your environments (DEV, TEST, RC, etc). You may also see the same service name for those, since they should be tech/purpose similar. For this, consider to use the service naming rules to differentiate those.
Featured Posts
