- Dynatrace Community
- Ask
- Synthetic Monitoring
- Re: Private Synthetic Locations
- Subscribe to RSS Feed
- Mark Topic as New
- Mark Topic as Read
- Pin this Topic for Current User
- Printer Friendly Page
- Mark as New
- Subscribe to RSS Feed
- Permalink
12 Oct 2023
06:51 AM
- last edited on
12 Oct 2023
11:21 AM
by
![]() MaciejNeumann
MaciejNeumann
Hi Team,
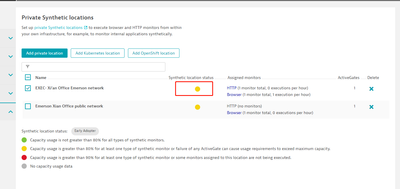
I'm facing one problem. I created one private location and used it in a HTTP API monitoring. At the first 3 days, the monitor can execute successfully. However, it failed all the time since yesterday. My scripts weren't changed. So I checked the private location and found the Synthetic locations status light is yellow.
I checked the dynatrace gateway service on my laptop, It's running
And then, I checked the documentation and checked the configuration one by one:
My laptop's configuration is satisfied the requirement (Win10, RAM 8G, CPU core:2 )
So I really didn't know why the Synthetic locations status light is yellow. Dose anyone can help me?
Solved! Go to Solution.
- Labels:
-
private synthetic locations
- Mark as New
- Subscribe to RSS Feed
- Permalink
12 Oct 2023 08:02 AM
Hello,
The yellow indicator means that you are running a number of synthetic monitors that reaching the AG limits, from the screenshot i can see that you are running only one monitor, so i think this is nit the case. the other reason is that you running only one AG for that location, which is not fulfilling the failover scenario.
Thanks,
Islam
- Mark as New
- Subscribe to RSS Feed
- Permalink
12 Oct 2023 08:07 AM
Thank you for your reply. if it's due to there's only one AG, why it can execute successfully for 3 days?
- Mark as New
- Subscribe to RSS Feed
- Permalink
12 Oct 2023 09:19 AM
It's likely 2 separate issues. The yellow colour for the location, is as Islam mentioned, because you only have 1 AG in the location so there is no failover available.
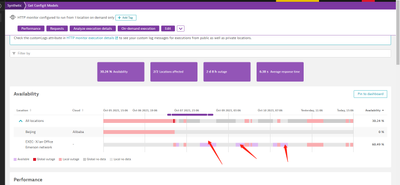
The failures should be investigated separately. If you drill down to the availability what are the causes of the failures?
- Mark as New
- Subscribe to RSS Feed
- Permalink
12 Oct 2023 10:07 AM - edited 12 Oct 2023 10:13 AM
Thank you for the information.
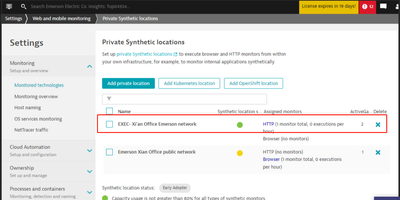
1. I created one more active gate just now. But my monitor still failed
2. The error from the monitor is "Request Timeout" Since yesterday. But I didn't do any changes on the script.
This is the monitor link:
Could you help to check it, please?
- Mark as New
- Subscribe to RSS Feed
- Permalink
12 Oct 2023 10:14 AM
Hi Quirinia,
we don't recommend adding links to your tenant in the community. Please can you open a chat to check your HTTP Monitor. A couple of things you can check yourself are:
can you curl successfully to the url that you are testing on the AG?
if you increase the request timeout does it complete? You can do this in the request using 'Adapt request timeout'
- Mark as New
- Subscribe to RSS Feed
- Permalink
12 Oct 2023 01:08 PM
Thank you!
Could you tell me where I can get the document regarding "increase the request timeout"?
- Mark as New
- Subscribe to RSS Feed
- Permalink
12 Oct 2023 01:11 PM
Yes, sure. It's the 'Adapt request timeout' option documented here
- Mark as New
- Subscribe to RSS Feed
- Permalink
12 Oct 2023 01:07 PM
All of these replies are spot on. The context of the yellow color can mean multiple things. In your case, I don't think 2 monitors are consuming 80% or more of the resources, rather its a warning that you are running synthetics on an AG that has no backup AG. So if this one goes down, your synthetic jobs cannot fail over and will not execute.
In terms of why you are seeing problem cards on your Synthetic for a particular region/location would need to be addressed at the transactional level of the monitor. HTTP Monitors will have basic information for the most part where click paths will have much more data in terms of the reason why a problem card is present and the issues surrounding it.
If there is an outage/problem raised with your test on a particular location/region its because the synthetic failed and you need to look at the details for that test in that time frame. It could be that the testing endpoint was down or the endpoint could not be reached etc...
Featured Posts


