This website uses Cookies. Click Accept to agree to our website's cookie use as described in our Privacy Policy. Click Preferences to customize your cookie settings.
Troubleshooting
Articles about how to solve the most common problems
Turn on suggestions
Auto-suggest helps you quickly narrow down your search results by suggesting possible matches as you type.
- Dynatrace Community
- Learn
- Troubleshooting
- How can I find which ActiveGate my HTTP Monitor execution ran on?
Options
- Subscribe to RSS Feed
- Mark as New
- Mark as Read
- Printer Friendly Page
Dynatrace Guru
Options
- Mark as New
- Subscribe to RSS Feed
- Permalink
01 Feb 2024 11:03 AM - edited 06 Mar 2026 04:00 PM
Summary
When you’re troubleshooting intermittent HTTP Monitor failures in Dynatrace, it’s often necessary to determine which Synthetic ActiveGate executed a specific monitor run—especially when using Private Synthetic Locations with multiple ActiveGates.
This guide explains how to quickly find the exact ActiveGate involved in an HTTP Monitor execution and what to do if the information isn’t immediately visible.
- Summary
- Problem
- Private Location Resolution
- (Latest Dynatrace) How to find the ActiveGate used for an HTTP Monitor execution
- (Classic) How to find the ActiveGate used for an HTTP Monitor execution
- Cluster and Public Locations Resolution
- What's Next
- Related reading
Problem
In Dynatrace, HTTP Monitor execution details show the synthetic location and engineId where the run occurred. How can this information be used to determine which specific ActiveGate executed the test?
Knowing this is essential when diagnosing:
- Intermittent failures
- Host‑specific issues
- Configuration differences
- Network or certificate problems
- Proxy‑related behavior
Private Location Resolution
(Latest Dynatrace) How to find the ActiveGate used for an HTTP Monitor execution
- Open a Notebook in Dynatrace.
- Add a DQL section.
- Paste in the following query:
fetch dt.synthetic.events |filter event.type == "http_monitor_execution" |fields timestamp, dt.synthetic.monitor.id, monitor.name, dt.entity.synthetic_location, location.name, event.id, result.engine.id, numberToHexString(toLong(result.engine.id)) |lookup [ fetch dt.entity.synthetic_location ], sourceField: dt.entity.synthetic_location, lookupField: id, fields: { location.name = entity.name } | fieldsRename hex = `numberToHexString(toLong(result.engine.id))` - You can refine the filter to search for specific executions or monitors. For example, you could search for only the monitor with id HTTP_CHECK-472DC1A4B78A1758 by adding to the filter.
|filter event.type == "http_monitor_execution" and dt.synthetic.monitor.id=="HTTP_CHECK-472DC1A4B78A1758" - Run the query
-
The
hexcolumn contains the ActiveGate ID in hexadecimal format.Copy this hex value and use it to search on the Deployment status > ActiveGates page to find the exact ActiveGate that ran the HTTP Monitor execution.
(Classic) How to find the ActiveGate used for an HTTP Monitor execution
-
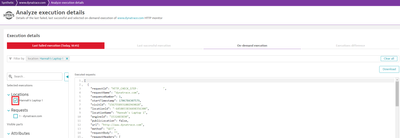
Navigate to the HTTP Monitor in Dynatrace.
-
Select Analyze execution details.
-
Choose the execution you want to investigate.
-
If multiple locations appear, ensure you select the correct one
-
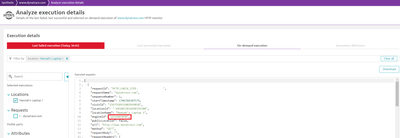
Inside the execution details, note the engineId value.
- Dynatrace displays this value in decimal format.
- However, the ActiveGates page uses hexadecimal (hex).
- Convert the decimal engineId to hex using:
- Your calculator
- Any online decimal‑to‑hex converter
Example:
Decimal:1532483830
Hex:5B57D8F6
- Go to Deployment Status > ActiveGates.
- Filter by ID.
- Enter the ID in hex format, prefixed with
0x:0x5B57D8F6You should now see the exact Synthetic ActiveGate that executed the monitor.
Cluster and Public Locations Resolution
Identifying the execution ActiveGate is not available through the UI.
Please open a chat and provide:
Please open a chat and provide:
- A link to the execution
- A short description of the issue
Support will help identify which ActiveGate processed the execution.
What's Next
If you weren't able to find the ActiveGate that ran the execution using the steps above, open a chat and a link to the execution you are interested.
Related reading
📖 Synthetic Troubleshooting Map
Comments


