- Dynatrace Community
- Learn
- Troubleshooting
- How to Match Percentile value for Data explorer and Multidimensional Analysis(MDA) for Calculated service metric?
- Subscribe to RSS Feed
- Mark as New
- Mark as Read
- Printer Friendly Page
- Mark as New
- Subscribe to RSS Feed
- Permalink
01 Jun 2023 07:15 AM - edited 01 Jun 2023 10:48 AM
Self Service Summary
Issue:
Unable to view Percentile value for Calculated service Metric in Data explorer.
Solution:
Understand the concept of Percentile value in Data explorer. Percentile value works for the Inbuilt metrics which are preloaded with environment. For e.g. AWS, Kubernetes, Azure, Vmware etc will have a percentile value in data explorer but if you have Calculated Service metric it will not directly show Percentile value but you would need to change the Visualization from Graph view to either TOP LIST/HoneyComb/Table View. Then on the right side you will find “FOLD TRANSFORMATION” Drop down, from there you can change it to PERCENTILE.
TASKS:
Please see below steps to check
- Create a Calculated metrics based on (Metric source) that you want to calculate
- Once you start seeing the data(at least 2hrs of data for percentile value) in data explorer change the Visualization to Top view or HoneyComb or Table view.
- Next click on FOLD transformation drop down and select Percentile and click RUN query.
You can now see that, the percentile value is calculated for the Merged Data points.
(https://www.dynatrace.com/support/help/shortlink/visualization-top-list#fold-transformation)
BEFORE Changing:
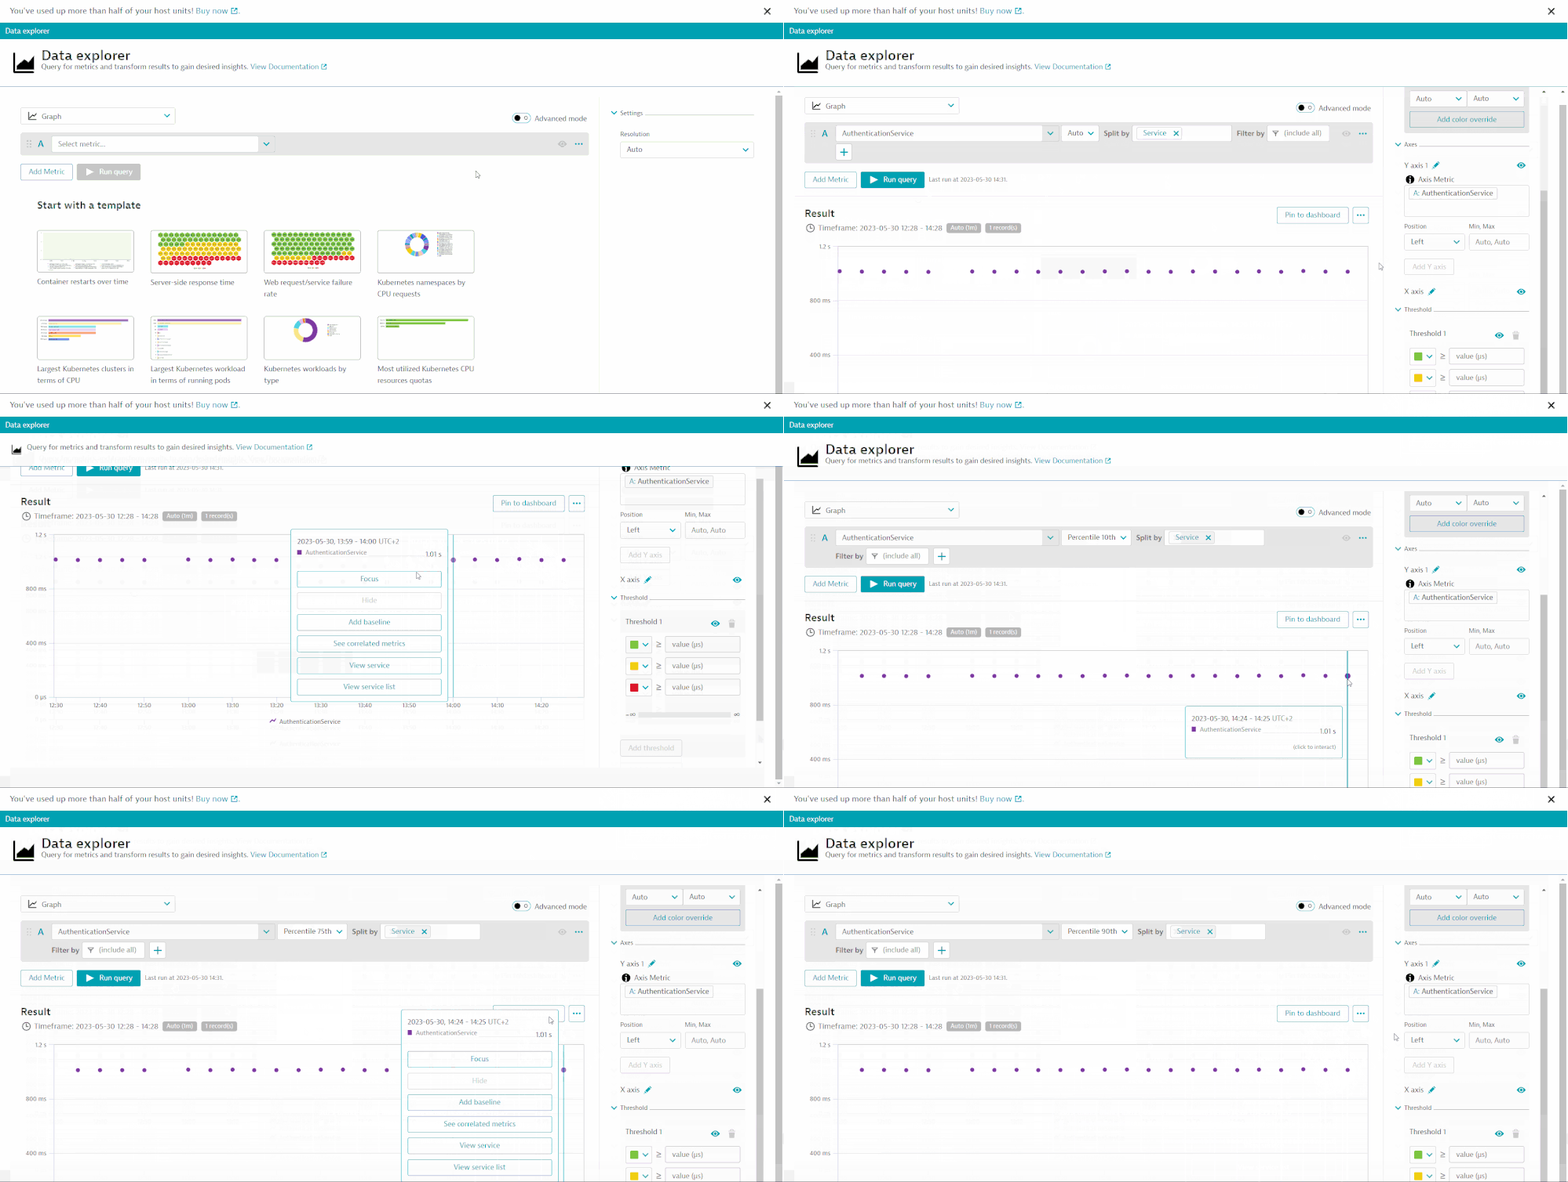
Here is a short demo of the service Not showing any Percentile data in Graph, Stacked visualisation
- In this, I created a Calculate service metric(Authentication service) and selected Split by Service
- After running the query, it the default aggregation shows Auto(avg) for response time.
- Now if you observe it carefully, I am changing the aggregation to Percentile but the values are not changing in Graph.
- This is because the Calculated Service metric doesn’t support Graph, Stacked visualization or visualization that has multiple data points.
- Percentile will only work for combined or merged data points like, PIE/Honeycomb/Table/TOP list.
- Below you will find the alternate workaround for getting percentile value for Calculated service metric.
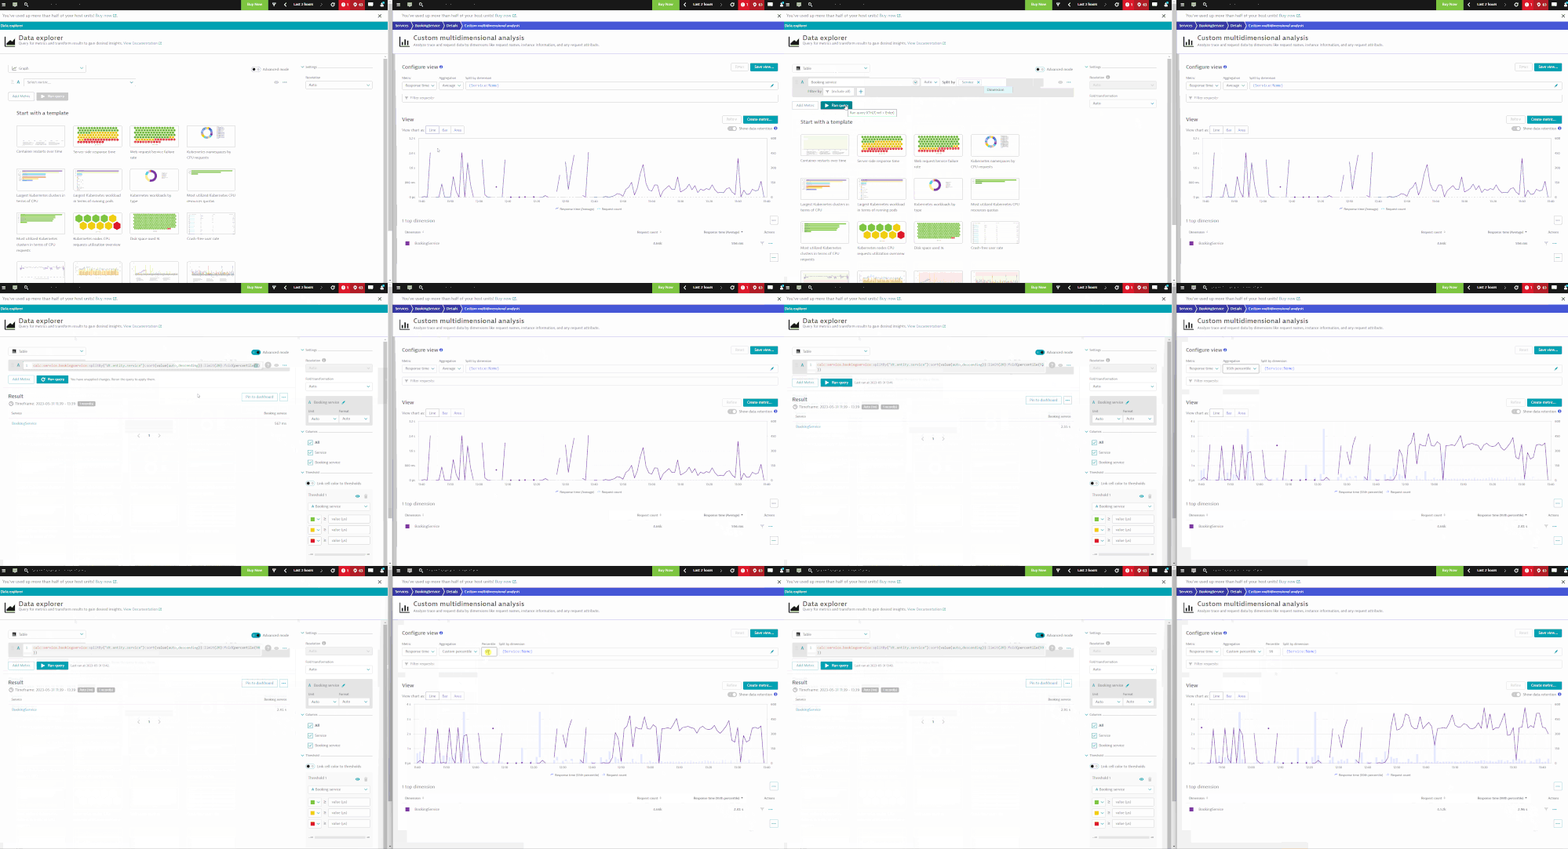
- Open Data explorer and change the Visualization to Table/TOP/Single view.
- Also open MDA for that service that you want to compare the value with(optional)
- Search for Calculated service metric in Data explorer and switch to Advance mode.
- Reason for advanced mode is because you will options to modify the percentile value same as in MDA.
- Now run the query and also update the value in MDA to compare.
- You will find almost similar value(not 100% same but close enough) for the service.


