- Dynatrace Community
- Learn
- Troubleshooting
- How to get the cordova build logs?
- Subscribe to RSS Feed
- Mark as New
- Mark as Read
- Printer Friendly Page
- Mark as New
- Subscribe to RSS Feed
- Permalink
on
03 Jan 2023
02:40 AM
- edited on
03 Jan 2023
08:43 AM
by
![]() MaciejNeumann
MaciejNeumann
What is the cordova build logs?
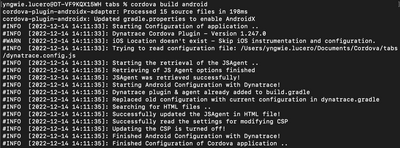
When building the project by running "cordova build android or ios" the dynatrace cordova plugin will generate some information instrumentation process that are added by the plugin (e.g. modifying build.gradle for android, modifying info.plist for iOS, adding the javascript agent for the webview and more).
Where can I find the build logs?
Usually the logs is generated after running the build. So it could be found in the terminal or any where you are running the command. It usually looks like this:

Alternatively, you can find it in the "logs" directory of the plugin folder (e.g. /plugins/dynatrace-cordova-plugin/logs/currentLog.txt)
Why do we need these logs?
If something went wrong with the instrumentation it should show up here. For example, if the javascript agent is not download then it will show an error here. There are some other examples highlighted here as well: https://www.npmjs.com/package/@dynatrace/cordova-plugin#troubleshooting-and-current-restrictions
Who will need these logs?
Most of the error messages in the logs are self explanatory so the development team should be able to get some context as to what went wrong during the instrumentation process and hopefully point them in the right direction. In addition to this, you can also provide this information to Dynatrace Support so that it will be easier to troubleshoot. You can simply copy the logs into a text file and attach to the support ticket.
great write up, to help expedite support tickets having this information handy will definitely cut down the time to resolution.
