- Dynatrace Community
- Learn
- Troubleshooting
- JMX Based Extensions - Missing Data Points
- Subscribe to RSS Feed
- Mark as New
- Mark as Read
- Printer Friendly Page
- Mark as New
- Subscribe to RSS Feed
- Permalink
on
11 Feb 2025
08:28 AM
- edited on
29 Apr 2025
10:11 AM
by
![]() PatrykAdamowicz
PatrykAdamowicz
Abstract
This troubleshooting guide will help you understand why the Metrics are not coming from your JMX extension.
Problem
This is one of the most common scenarios, where the Configuration is created and is in OK state but Metrics are not reporting Data , the most common reason is non Exposed Mbeans on the process.
Troubleshooting steps
The first thing that needs to be done is making sure that the process is properly injected.
After identifying the Process, we need to identify the MBeans Domains that are supposed to be used. We know for multiple extensions, we use different Domains :
- For Tomcat we expect MBeans under Catalina domain and DataSource type
- For WebSphere we expect MBeans under WebSphere domain and ConnectionPoolStats type
- For Jboss we expect Mbeans under jboss.as domain and subsystem=datasources
- For IBM WebSphere Liberty we expect Mbeans under WebSphere domain and type (ThreadPoolStats,ServletStats,JvmStats,RequestTimingStats)
- For WebLogic we excpect Mbeans under com.bea domain and type (JDBCDataSourceRuntime,JDBCOracleDataSourceRuntime,weblogic.j2ee.descriptor.wl.JDBCConnectionPoolParamsBean)
- For Kafka we expect Mbeans under kafka.server , kafka.producer , kafka.consumer , kafka.connector , kafka.network , kafka.controller , kafka.log , kafka.connect domains.
- For ActiveMQ Classic we expect Mbeans under org.apache.activemq domain and type=Broker
- For Eclipse Jetty we expect Mbeans under :
- org.eclipse.jetty.util.thread domain and type=queuedthreadpool
- org.eclipse.jetty.server.handler domain and type=statisticshandler
- org.eclipse.jetty.server:context=* domain and type=connectorstatistics
You'll need to make sure that the Process is exposing the correct MBeans, which can be checked through Jconsole :
- Start JConsole:
- Open a terminal or command prompt.
- Type jconsole and press Enter. This will launch the JConsole application.
- Connect to the JVM:
- In the JConsole connection dialog, select the Java process you want to monitor. If it's a remote process, enter the hostname and port number.
- Navigate to the MBeans tab:
- Once connected, go to the MBeans tab. This tab allows you to interact with the Java Management Extensions (JMX) MBeans.
- Locate the Domain:
- In the MBeans tab, you'll see a list of domains. Expand the domain you're interested in to see its MBeans.
- Check Members:
- Within the domain, look for MBeans that represent the members. These could be under various categories like Attributes, Operations, or Notifications.
For more detailed information, you can refer to the Oracle JConsole documentation
Only Some Metrics Missing Data Points:
In the case that only some metrics are not reporting data and not all the metrics, the idea is to "Find" which query is being used by the extension and make sure that the MBeans have the right path and data exists. For this, you'll need to find the exact query on the extension.yaml file
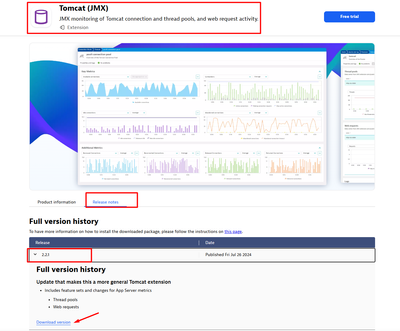
- Navigate to Dynatrace Hub | Hub Home
- Search and Navigate to the extension needed from the search bar
- Navigate to the Tab Release notes
- Expand the version that you're using, Download the package, and extract it
- Extract the extension.zip file
- On extension.yaml file, look for the metric that is missing
- Example: tomcat.bytesReceived.count
- The query that is used for this metric :
- Internally, you need to make sure that the MBeans are exposing these values.
What's next
Please reach out to support if this article does not help. In the support ticket, please provide:
- Agent support archive of the Host where the monitored process run
- ID of the host and the process
- Screenshots from the JConsole
- Exact metrics that are not collected


